Here in New South Wales, last year’s bushfires over late spring and into summer were astoundingly bad, and there were days where Sydney had the poorest air quality on the entire planet. Everyone was watching the PM2.5 values, and there were days where Kristina couldn’t go outside because of her asthma. I figured it’d be neat to set up a Raspberry Pi-powered air quality sensor and had ordered the sensor back in February but didn’t get around to putting it into service until now.
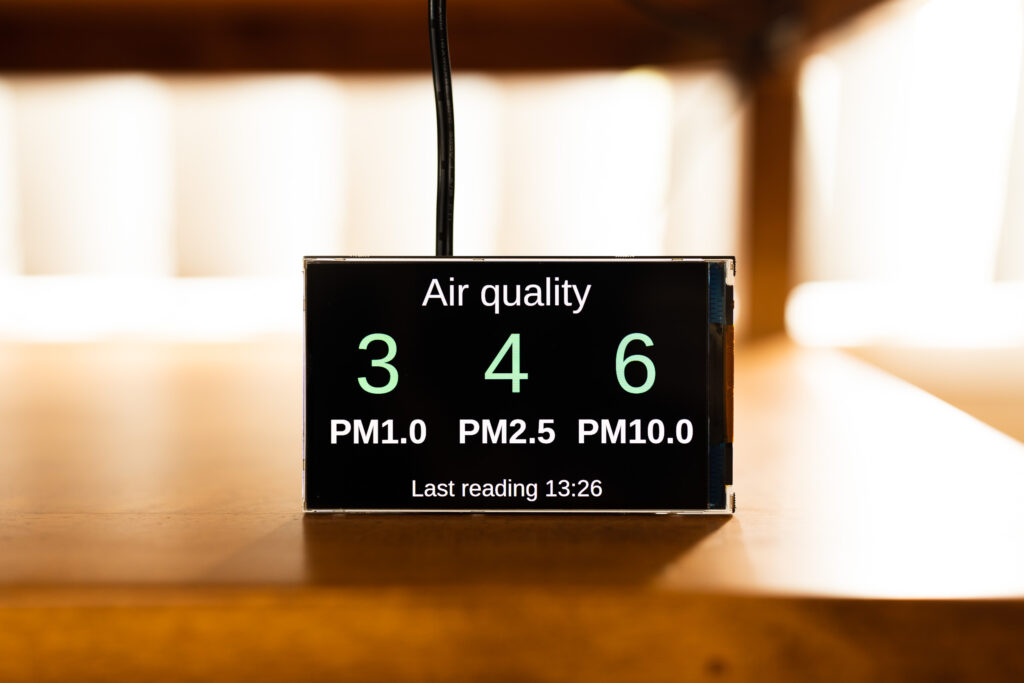
This is the bit that lives inside so we can easily see the latest reading:

It uses the same sort of setup as my Pimoroni display, and I updated my pi-home-dashboard to add a second page to display the values from the air quality reader.
The sensor itself is a Plantower PMS5003 sensor and is attached to the same Raspberry Pi that the outdoor temperature sensor is on. Adafruit’s instructions on getting it set up were pretty straightforward, and they also give some sample code for how to read it, but it’s in Python which I intensely dislike (I don’t really even have any strong feelings about the language itself one way or the other, but I’ve never had a good experience with the damn package management around it, so I do my damnedest to avoid it). I was able to write the same logic in TypeScript instead — though had to consult the clever people on Ars Technica because parsing the output from the sensor involves things like bit-shifting which is quite low-level and something I’m utterly unfamiliar with — and chucked the whole thing up on GitHub. It takes ten readings and averages them, and has an HTTP endpoint for pulling the latest values.
I’ve set the front-end up so the colour of the numbers will change to orange and red depending on how bad the air quality is, but hopefully it’s a long while before we actually see that in action!
Cool!