Monitoring indoor air quality, and outdoor temperature sensor woes
Previously on Monitor (And Automate) All The Things:
- 11th April, 2024 – Better environmental monitoring with the BME280 temperature sensor
- 20th November, 2023 — Automating Raspberry Pi setup (and ESP32, and Linode) with Ansible
- 8th October, 2021 — Upping my monitoring game with MQTT
- 26th July, 2021 — More fun with temperature sensors: ESP32 microcontrollers and MicroPython
- 25th November, 2020 — More Raspberry Pi-powered monitoring: air quality!
- 7th June, 2020 — More space: the Pimoroni HyperPixel4 display on a Raspberry Pi Zero W
- 17th February, 2018 — More Raspberry Pi adventures: the Pi Zero W and PaPiRus ePaper display
- 30th December, 2017 — Temperature sensors: now powered by Raspberry Pi
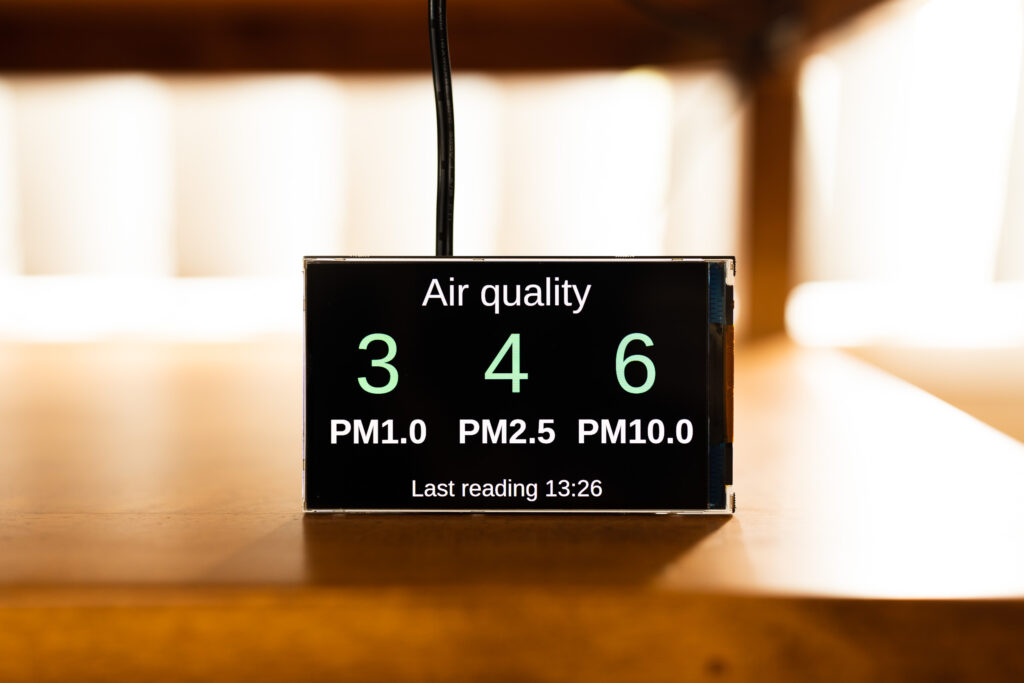
At the end of my last post on the subject I mentioned I was going to add an ENS160 air quality sensor to my arsenal of home monitoring sensors. I actually got that done only a couple of weeks after that blog post was published and it was pretty straightforwards, though I ended up forking the ENS160 library I’d found so I could more easily configure it and have it work better for my ESP32 code architecture.
Because I2C devices like the BME280 can be daisy-chained together and Core Electronics’ sensors thoughtfully have two STEMMA QT connectors on them, I was able to refactor my esp32-sensor-reader-mqtt code to allow for multiple sensors per ESP32 board (which in turn required refactoring of my Pi Home Dashboard Admin page as well). So now we still need only a single ESP32 board each in the office and lounge room, but both of them have a temperature/humidity and indoor air quality sensor attached to them! It’s really interesting watching the huge increase in indoor air quality we get as soon as we open the windows and let the fresh air in (when the weather is amenable to that happening, of course), and having this data is making me much more eager to crack open even just a couple of windows whenever we can.
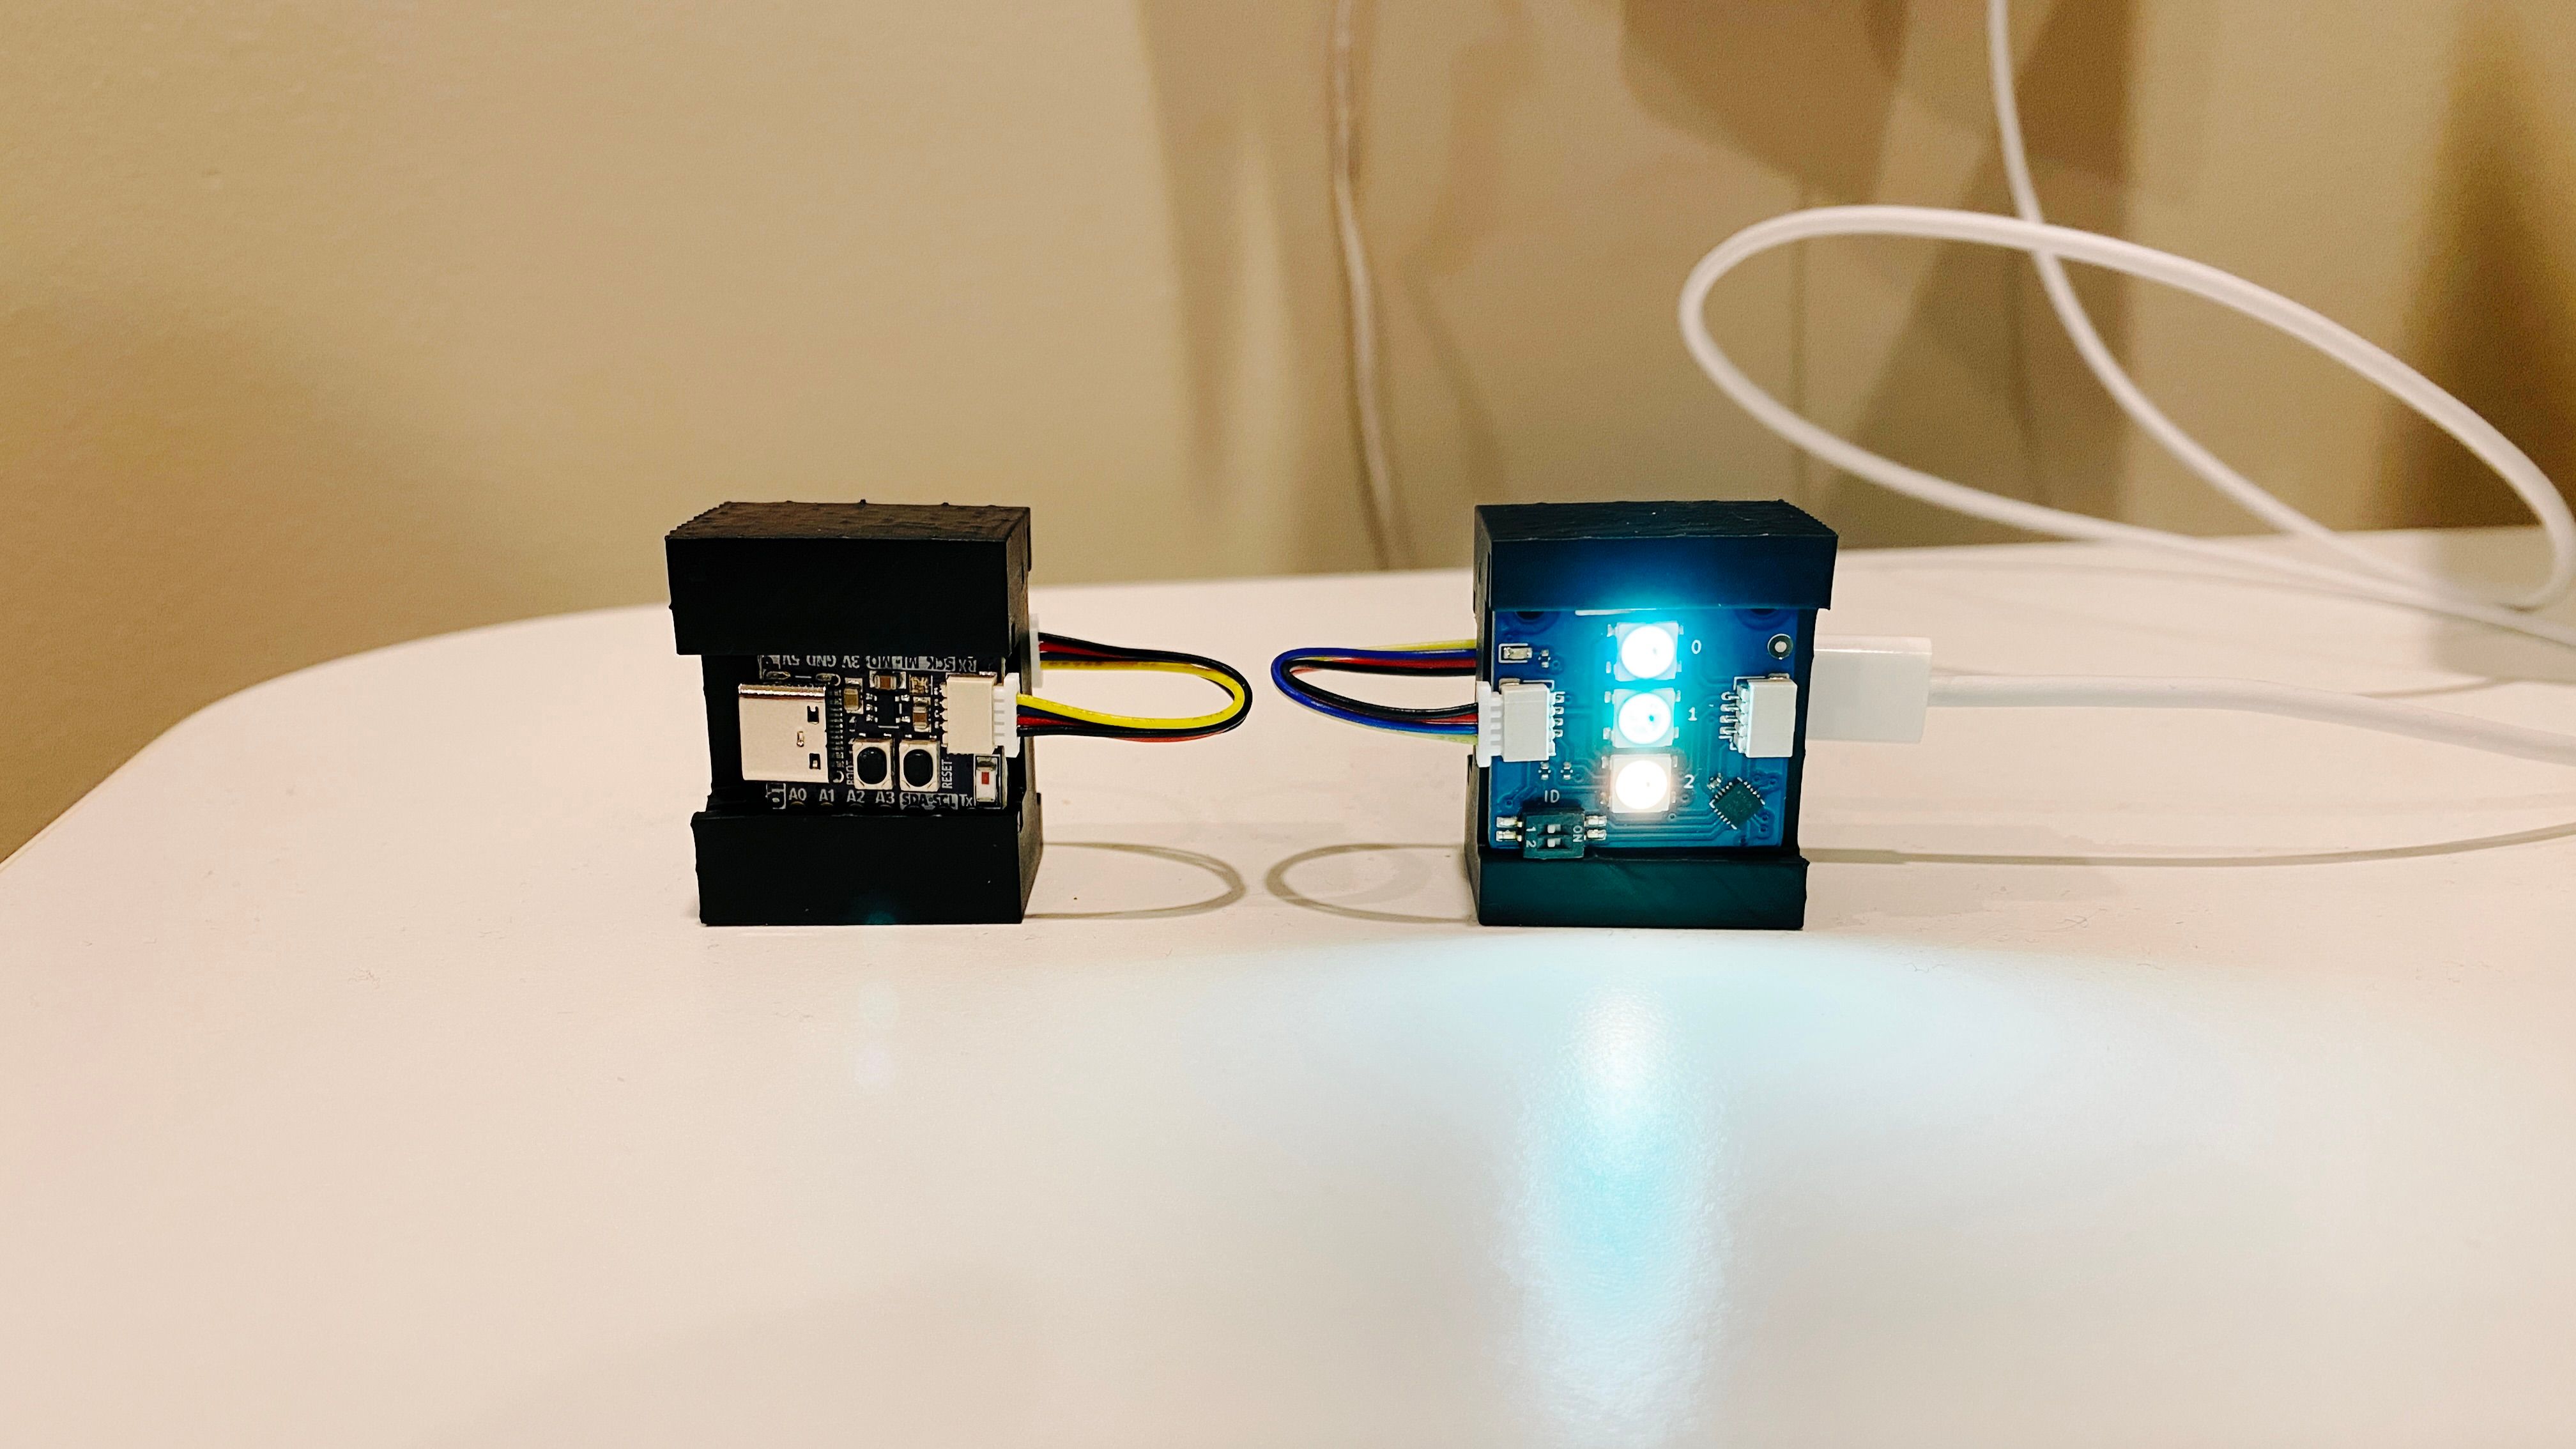
For my birthday this year I got a little starter kit I got from Core Electronics that has a bunch of sensors and wires and bits and bobs in it, and one of those bits and bobs was a board with three LEDs on it and a STEMMA QT connector. I was pondering what I could do with it, then hit upon the great idea of using it to give a visual indication of what the outdoor dew point, outdoor air quality, and indoor quality was without needing to display full numbers (ranging from blue being the best, through to yellow being not great, and red being actively bad). I used my esp32-sensor-reader-mqtt code as a base and wrote some code (Update April 2024: I’ve rolled this into the main esp32-sensor-reader-mqtt codebase) to listen to the relevant MQTT topics and change the LED colours based on thresholds for the values it received.
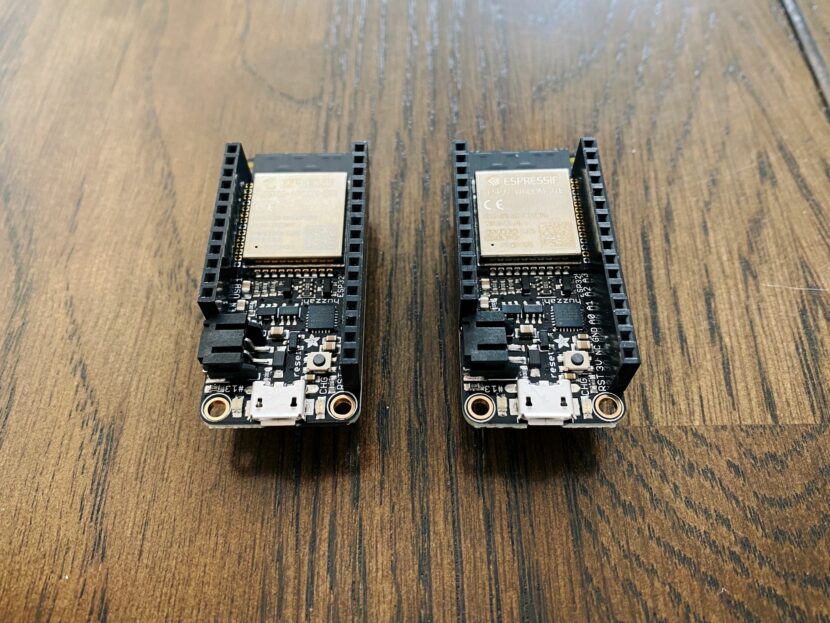
I wanted this whole setup to be fairly compact, not much larger than the LED board itself, and I discovered that Adafruit makes an ESP32 that is TINY and has a built-in STEMMA QT connector so I wouldn’t need to do any soldering: the QT Py ESP32 Pico. I also realised I would need some way of holding this all neatly together instead of being an ugly pile of wires everywhere, and so had my first foray into 3D printing! I used Tinkercad to design a holder, and a friend has a 3D printer and so was able to print out the prototype for me. It turned out the measurements weren’t quite correct so I did a bit of tweaking, got a second printing, and after a coating with black paint via my airbrush, hey presto!
We have two of these LED boards set up, sitting next to the Raspberry Pis that show the temperature/humidity dashboard in the lounge room and the office. I also hooked the ESP32s into my MQTT topic setup that the Raspberry Pis listen to to turn their display backlight off each night at midnight and back on in the morning at 7am so we don’t have blindingly bright LEDs lighting up the whole lounge room and office at night.
These have been running since the end of May with zero problems, just quietly displaying their data and turning off and back on as required!
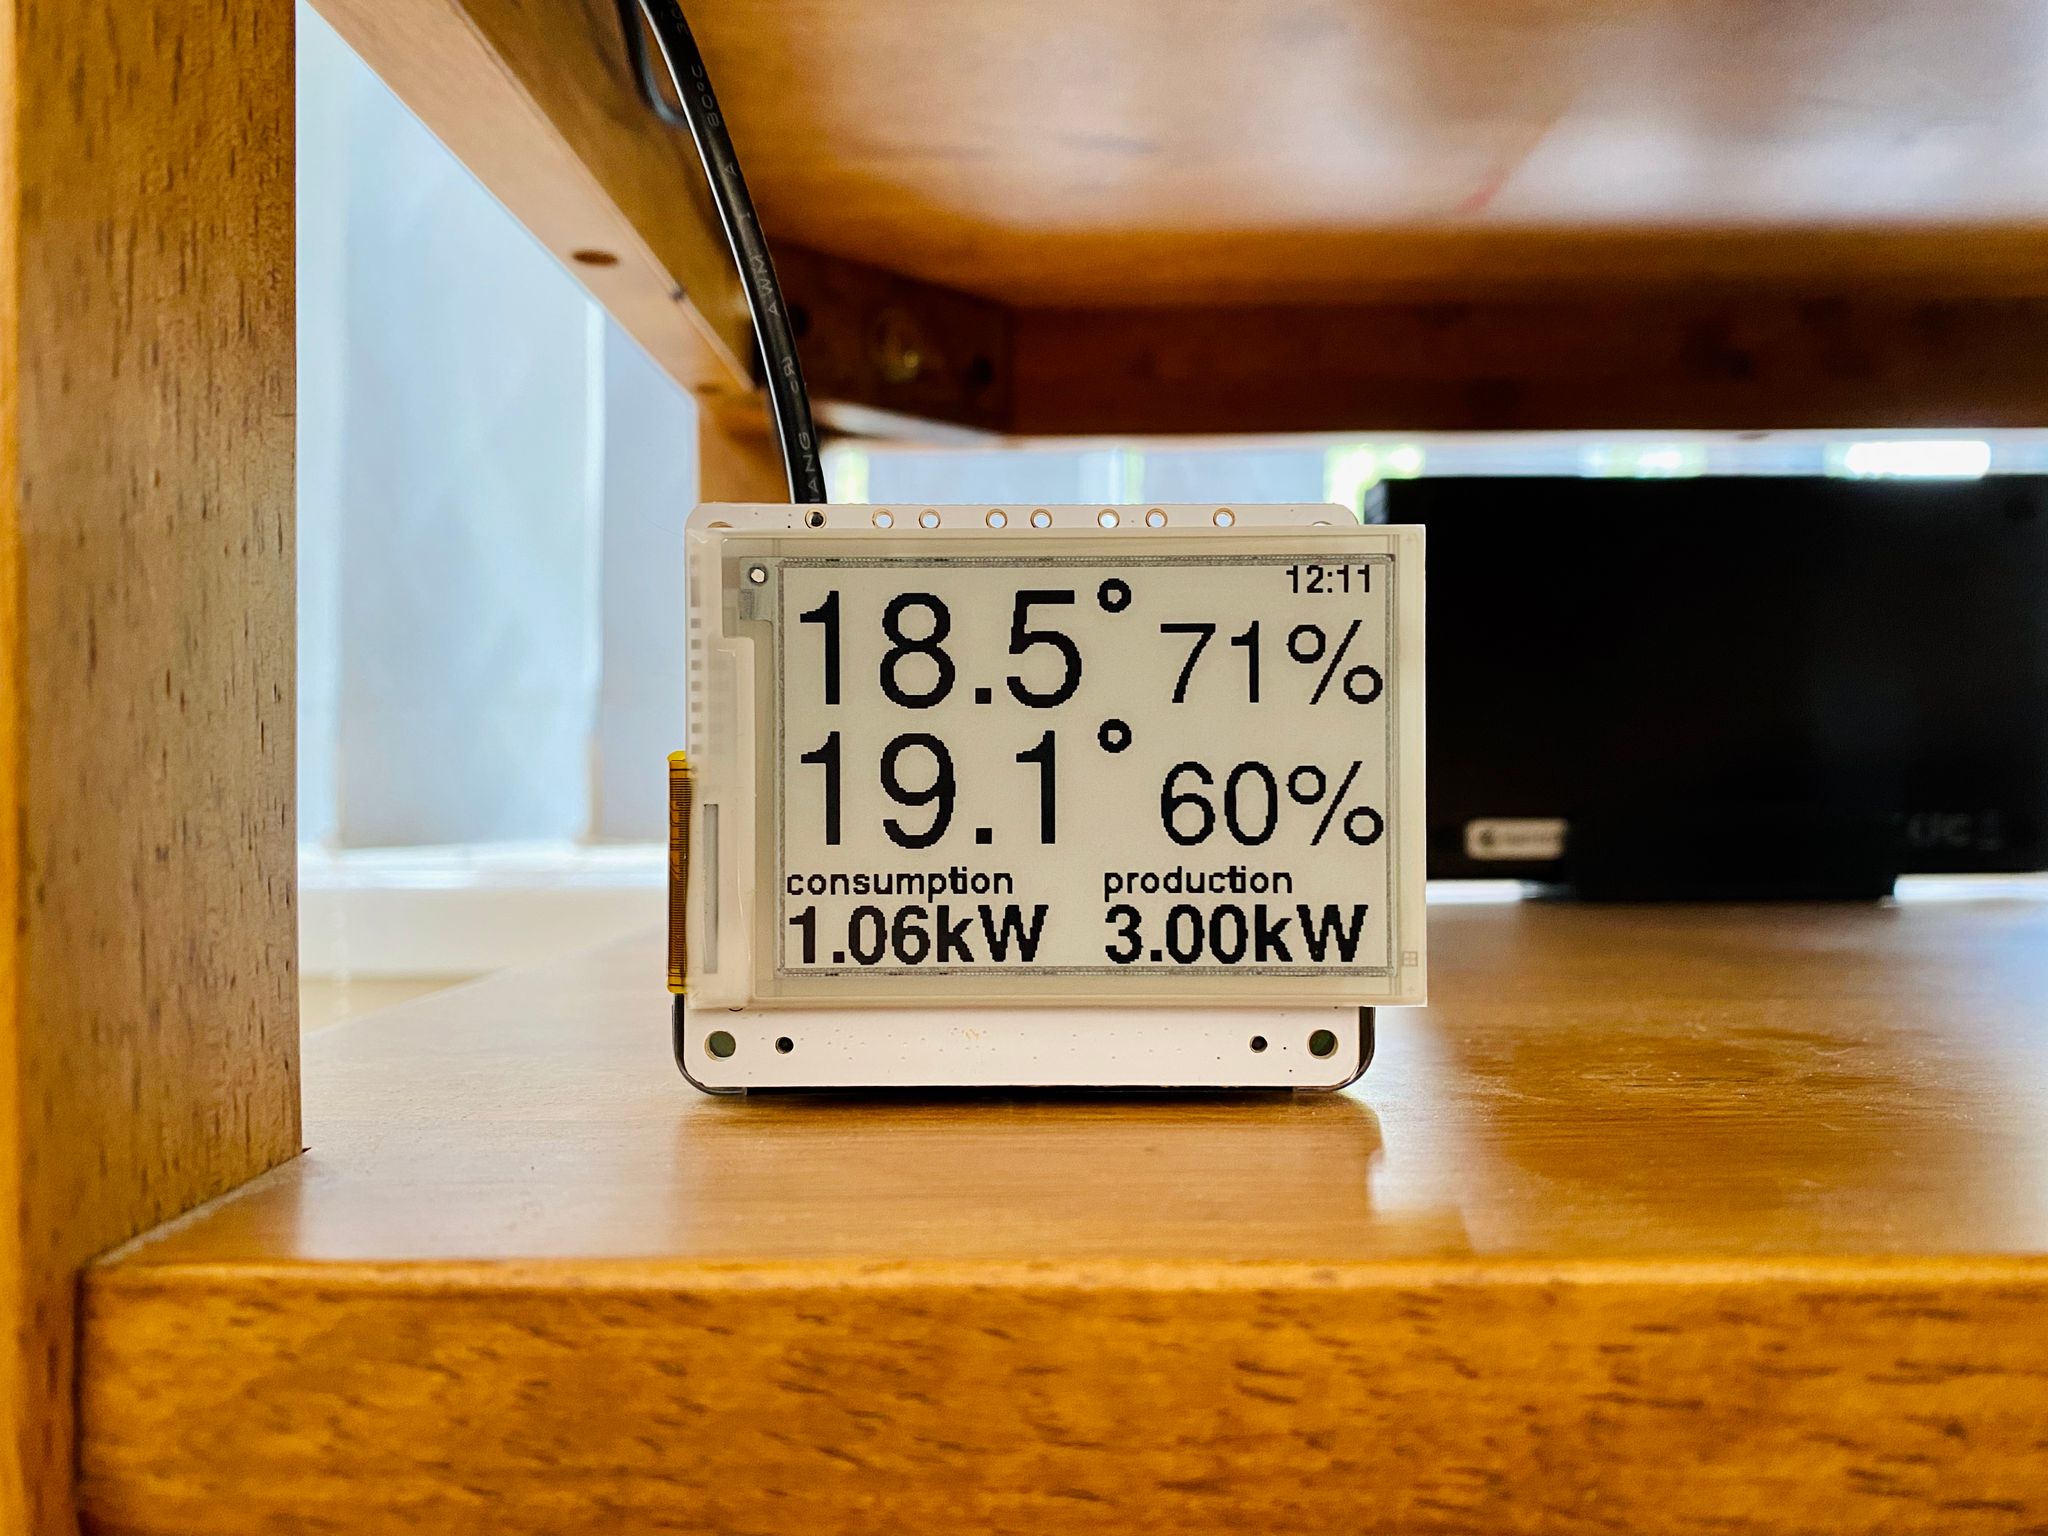
Also in my previous post, I said that I’d switched to the Bosch BME280 temperature/humidity sensors because the DHT22 that was outside would become saturated after a long enough period of high humidity and would display wildly incorrect humidity readings. Unfortunately I subsequently discovered that the same thing happens with the BME280 because it turns out they actually use the same type of technology for their humidity sensor as the DHT22. 😑 They’re definitely more accurate indoors and I’m happily using them in the lounge room and office, but we had a spate of really wet days in winter this year and the BME280 that was outside ended up in the exact same state as the DHT22s, despite not actually ever being directly exposed to rain.
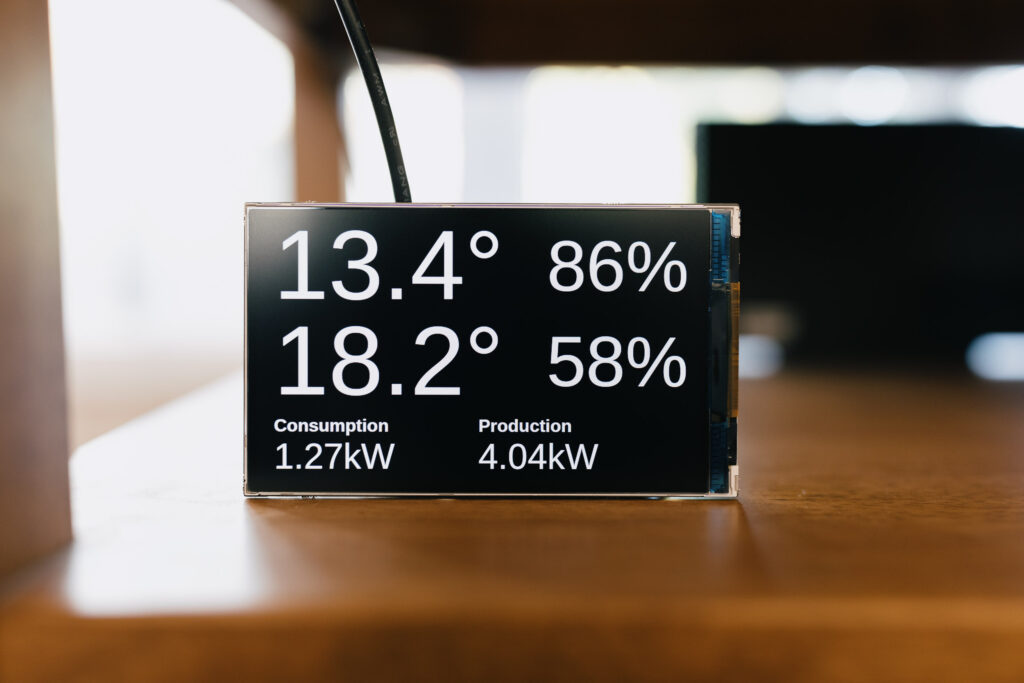
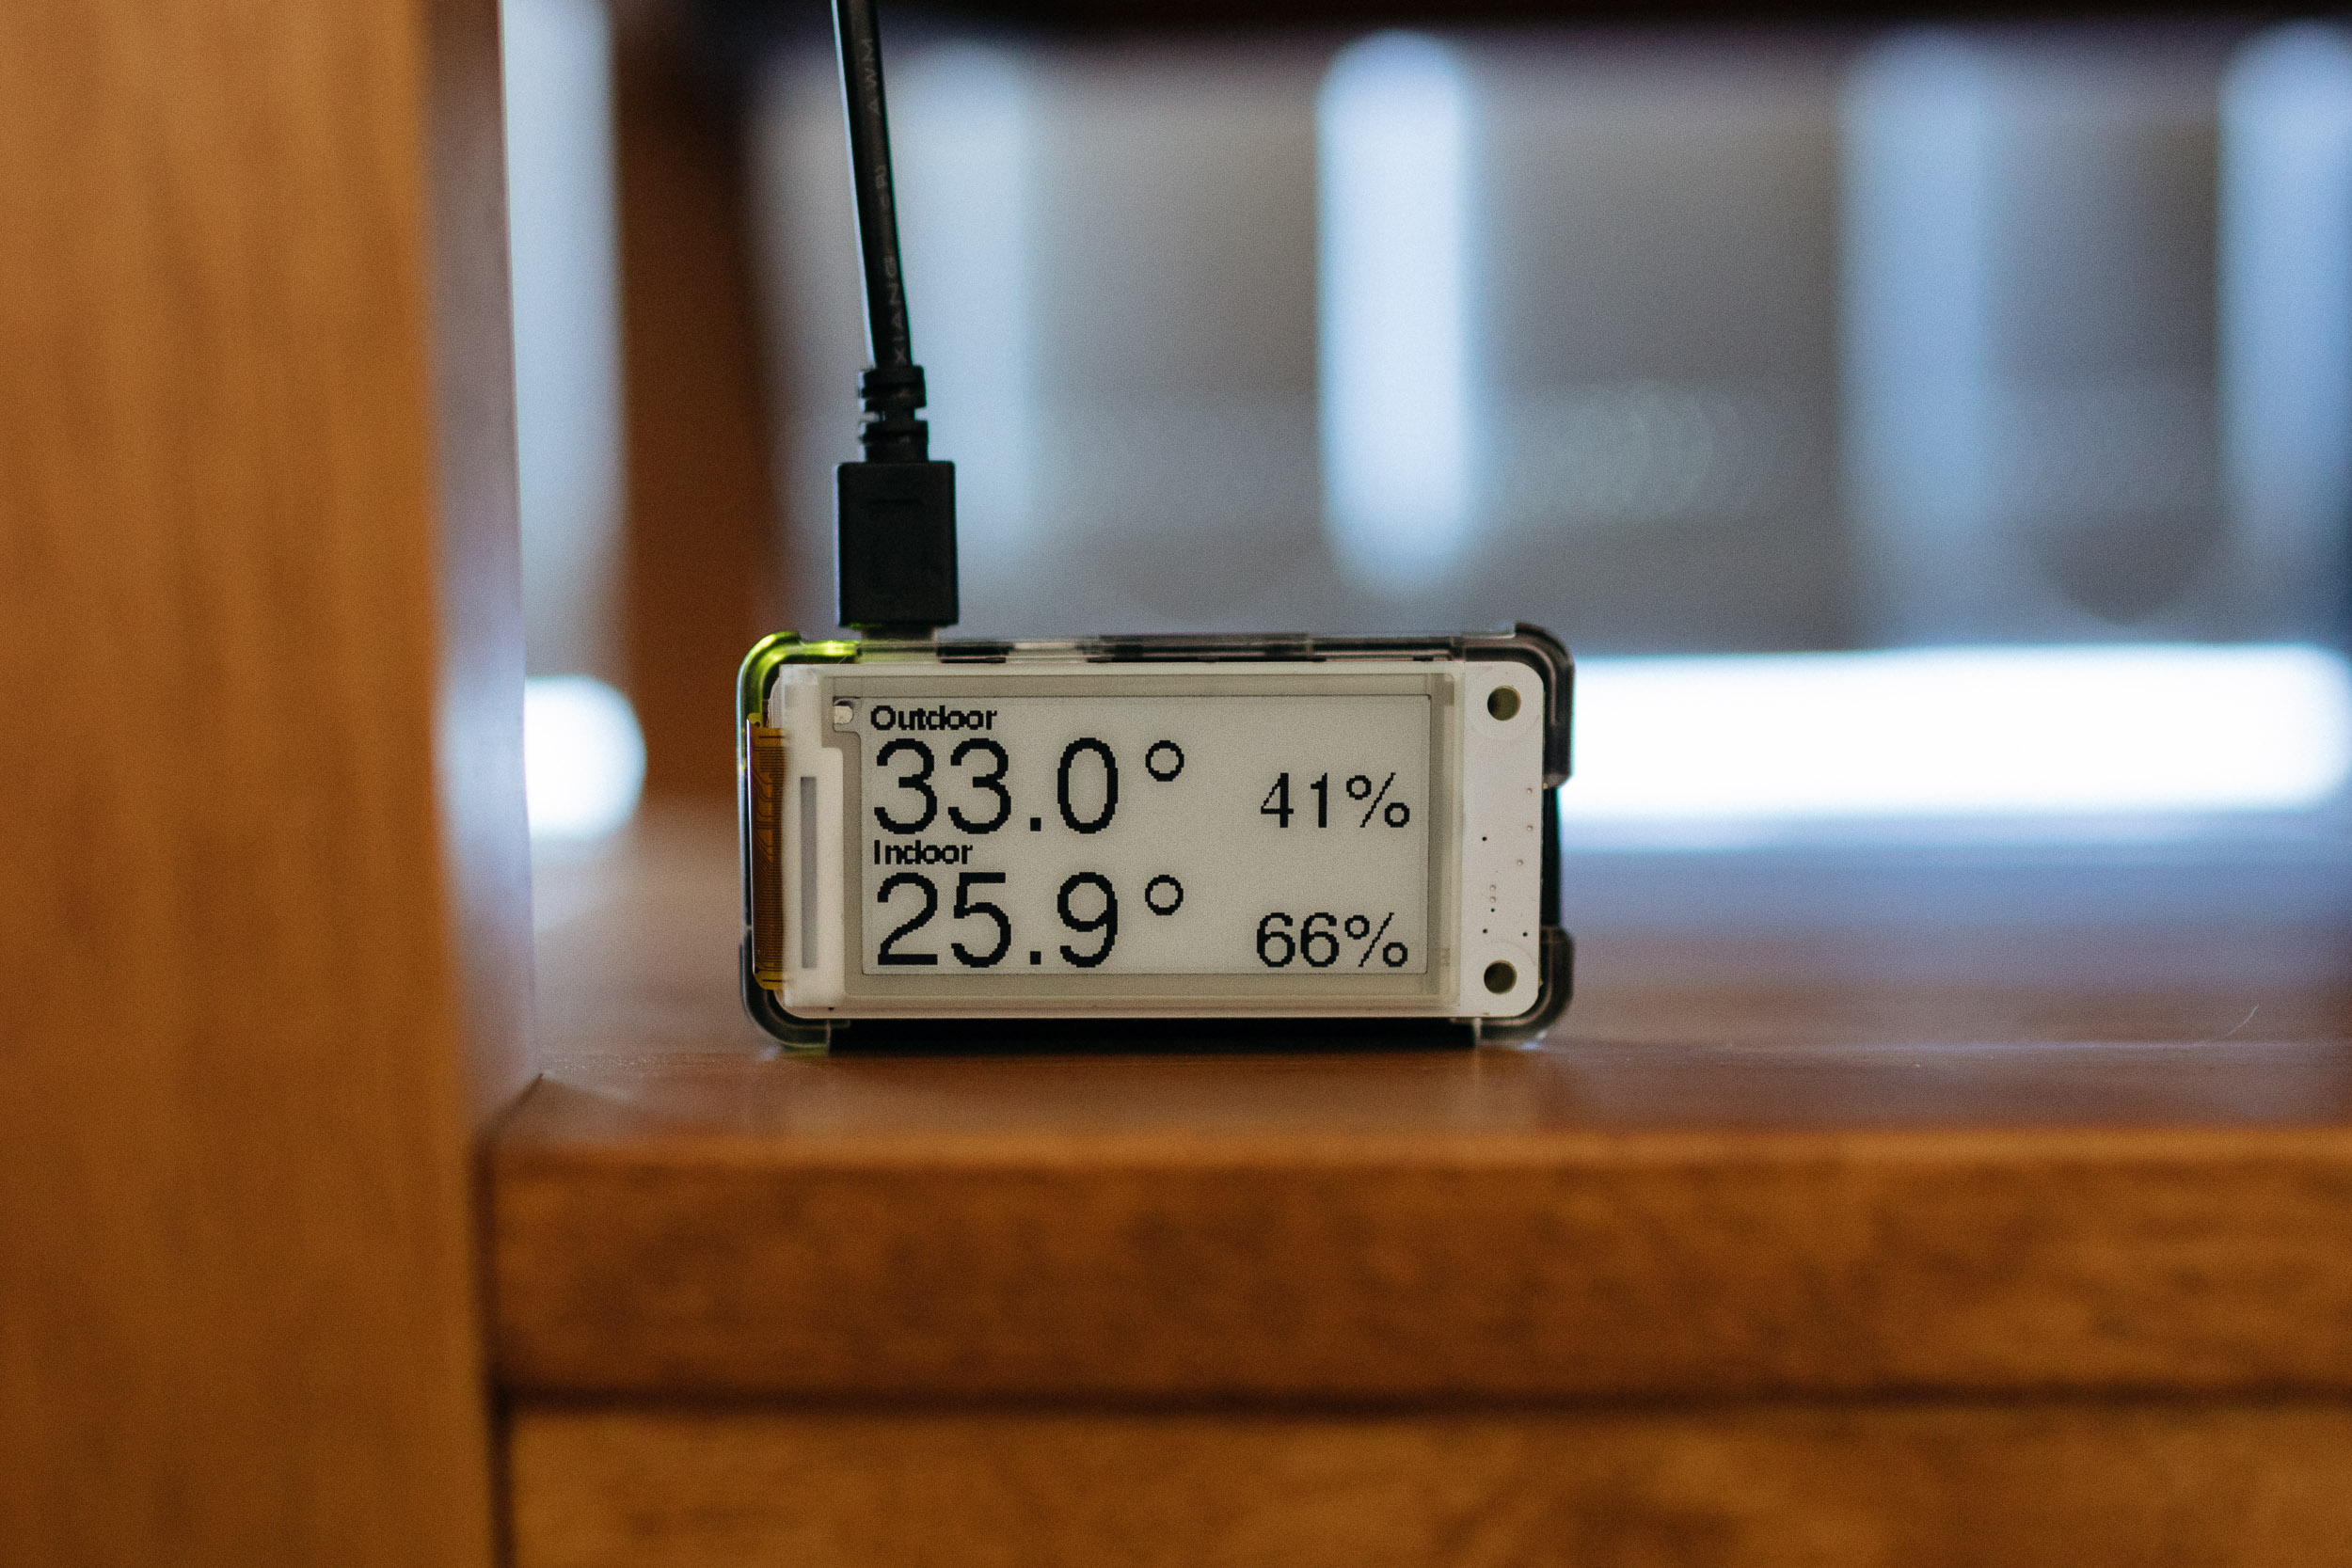
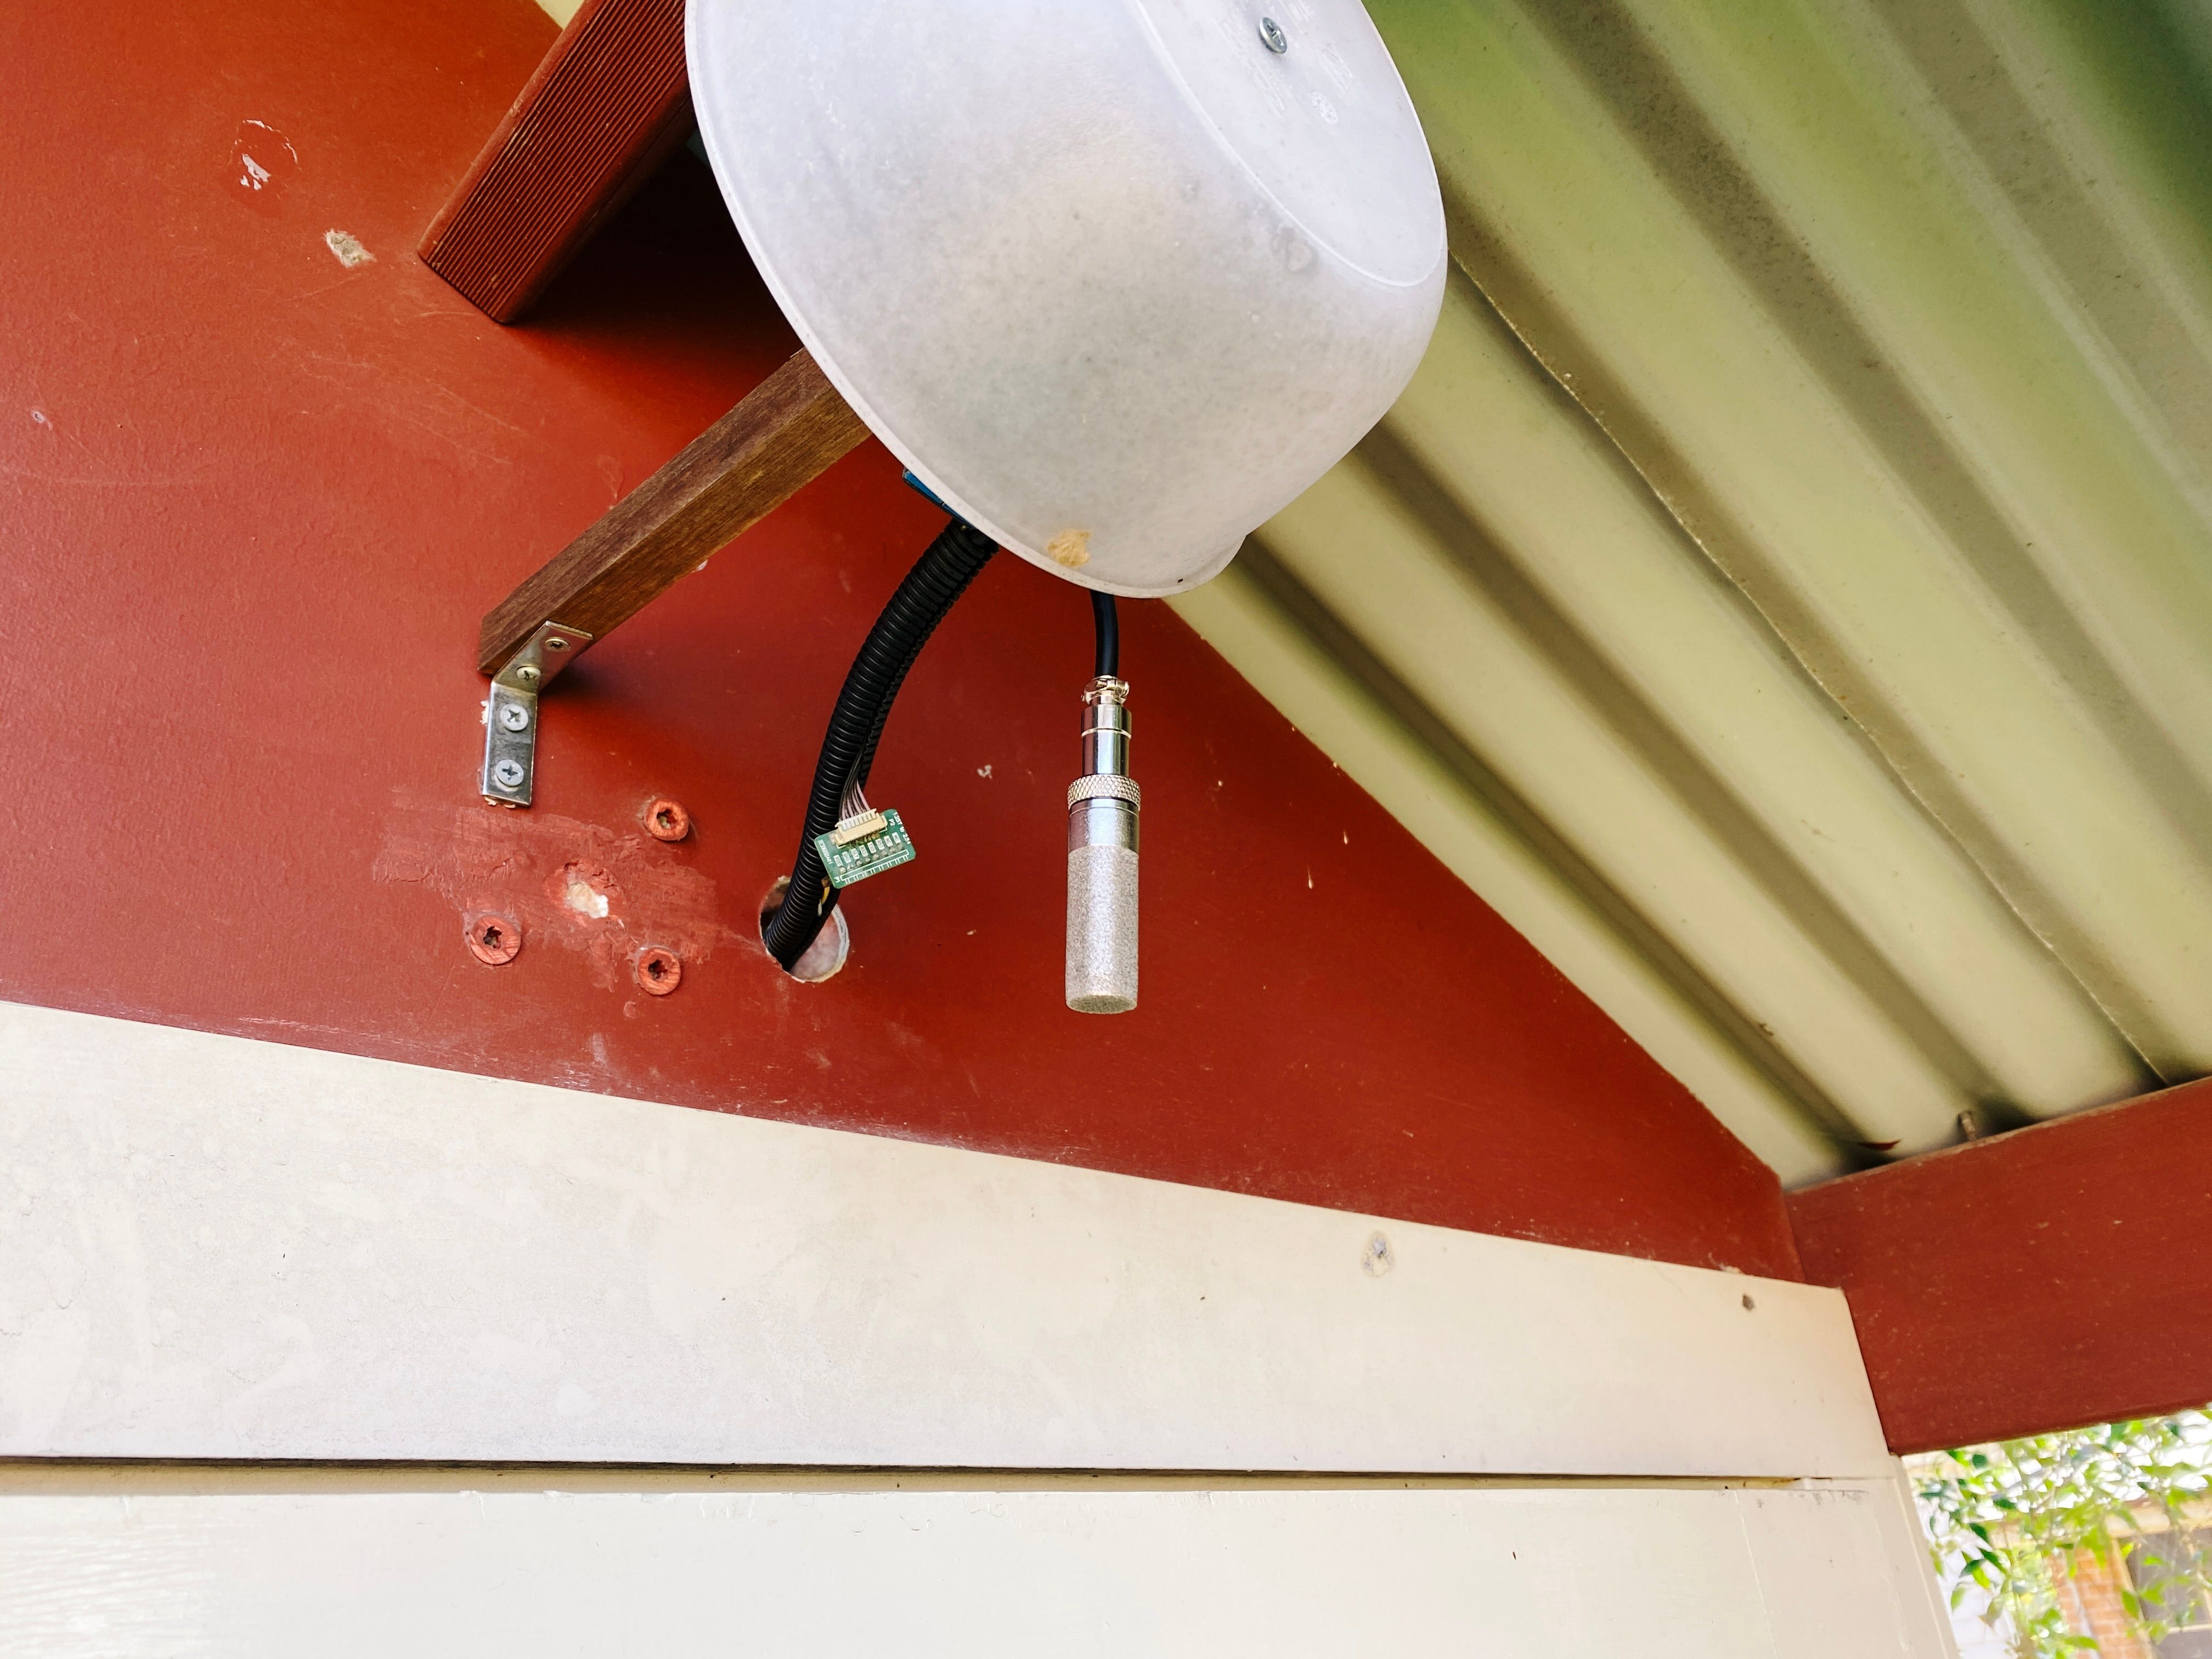
Queue a bunch more research, and I finally found something that uses a totally different type of technology for measuring humidity and is designed to actually work outside, and it even has a little built-in heater than you can trigger to dry the sensor out, the Sensiron SHT-30 (which I will never not read as “sense-iron” rather than what I assume they were going for, “sensy-ron”). Adafruit has packaged this up into a weatherproofed mesh package so I bought one of those, updated my esp32-sensor-reader-mqtt code again (I continue to remain delighted at how the architecture for this whole project has allowed me to extremely easily add additional sensors without a whole lot of effort), and it’s been live “in production” as it were since August of this year with absolutely zero problems:
I had to make a minor change to the SHT-30 library I’d found to allow for turning the built-in heater on and off so have forked it myself, though I think I could probably get away with not having the heater functionality after all… a friend of mine has the same sensor packed up into a little commercially-purchasable box without the heater being used and his has been sitting outside for over a year with no problems.
One difference between the BME280 and the SHT-30 is that the BME280 calculates the dew point, whereas the SHT-30 only sends temperature and humidity. However, I discovered that you can actually calculate the dew point yourself given a temperature and humidity value, so I was able to have an option to send dew point data for both the DHT22 and the SHT-30!
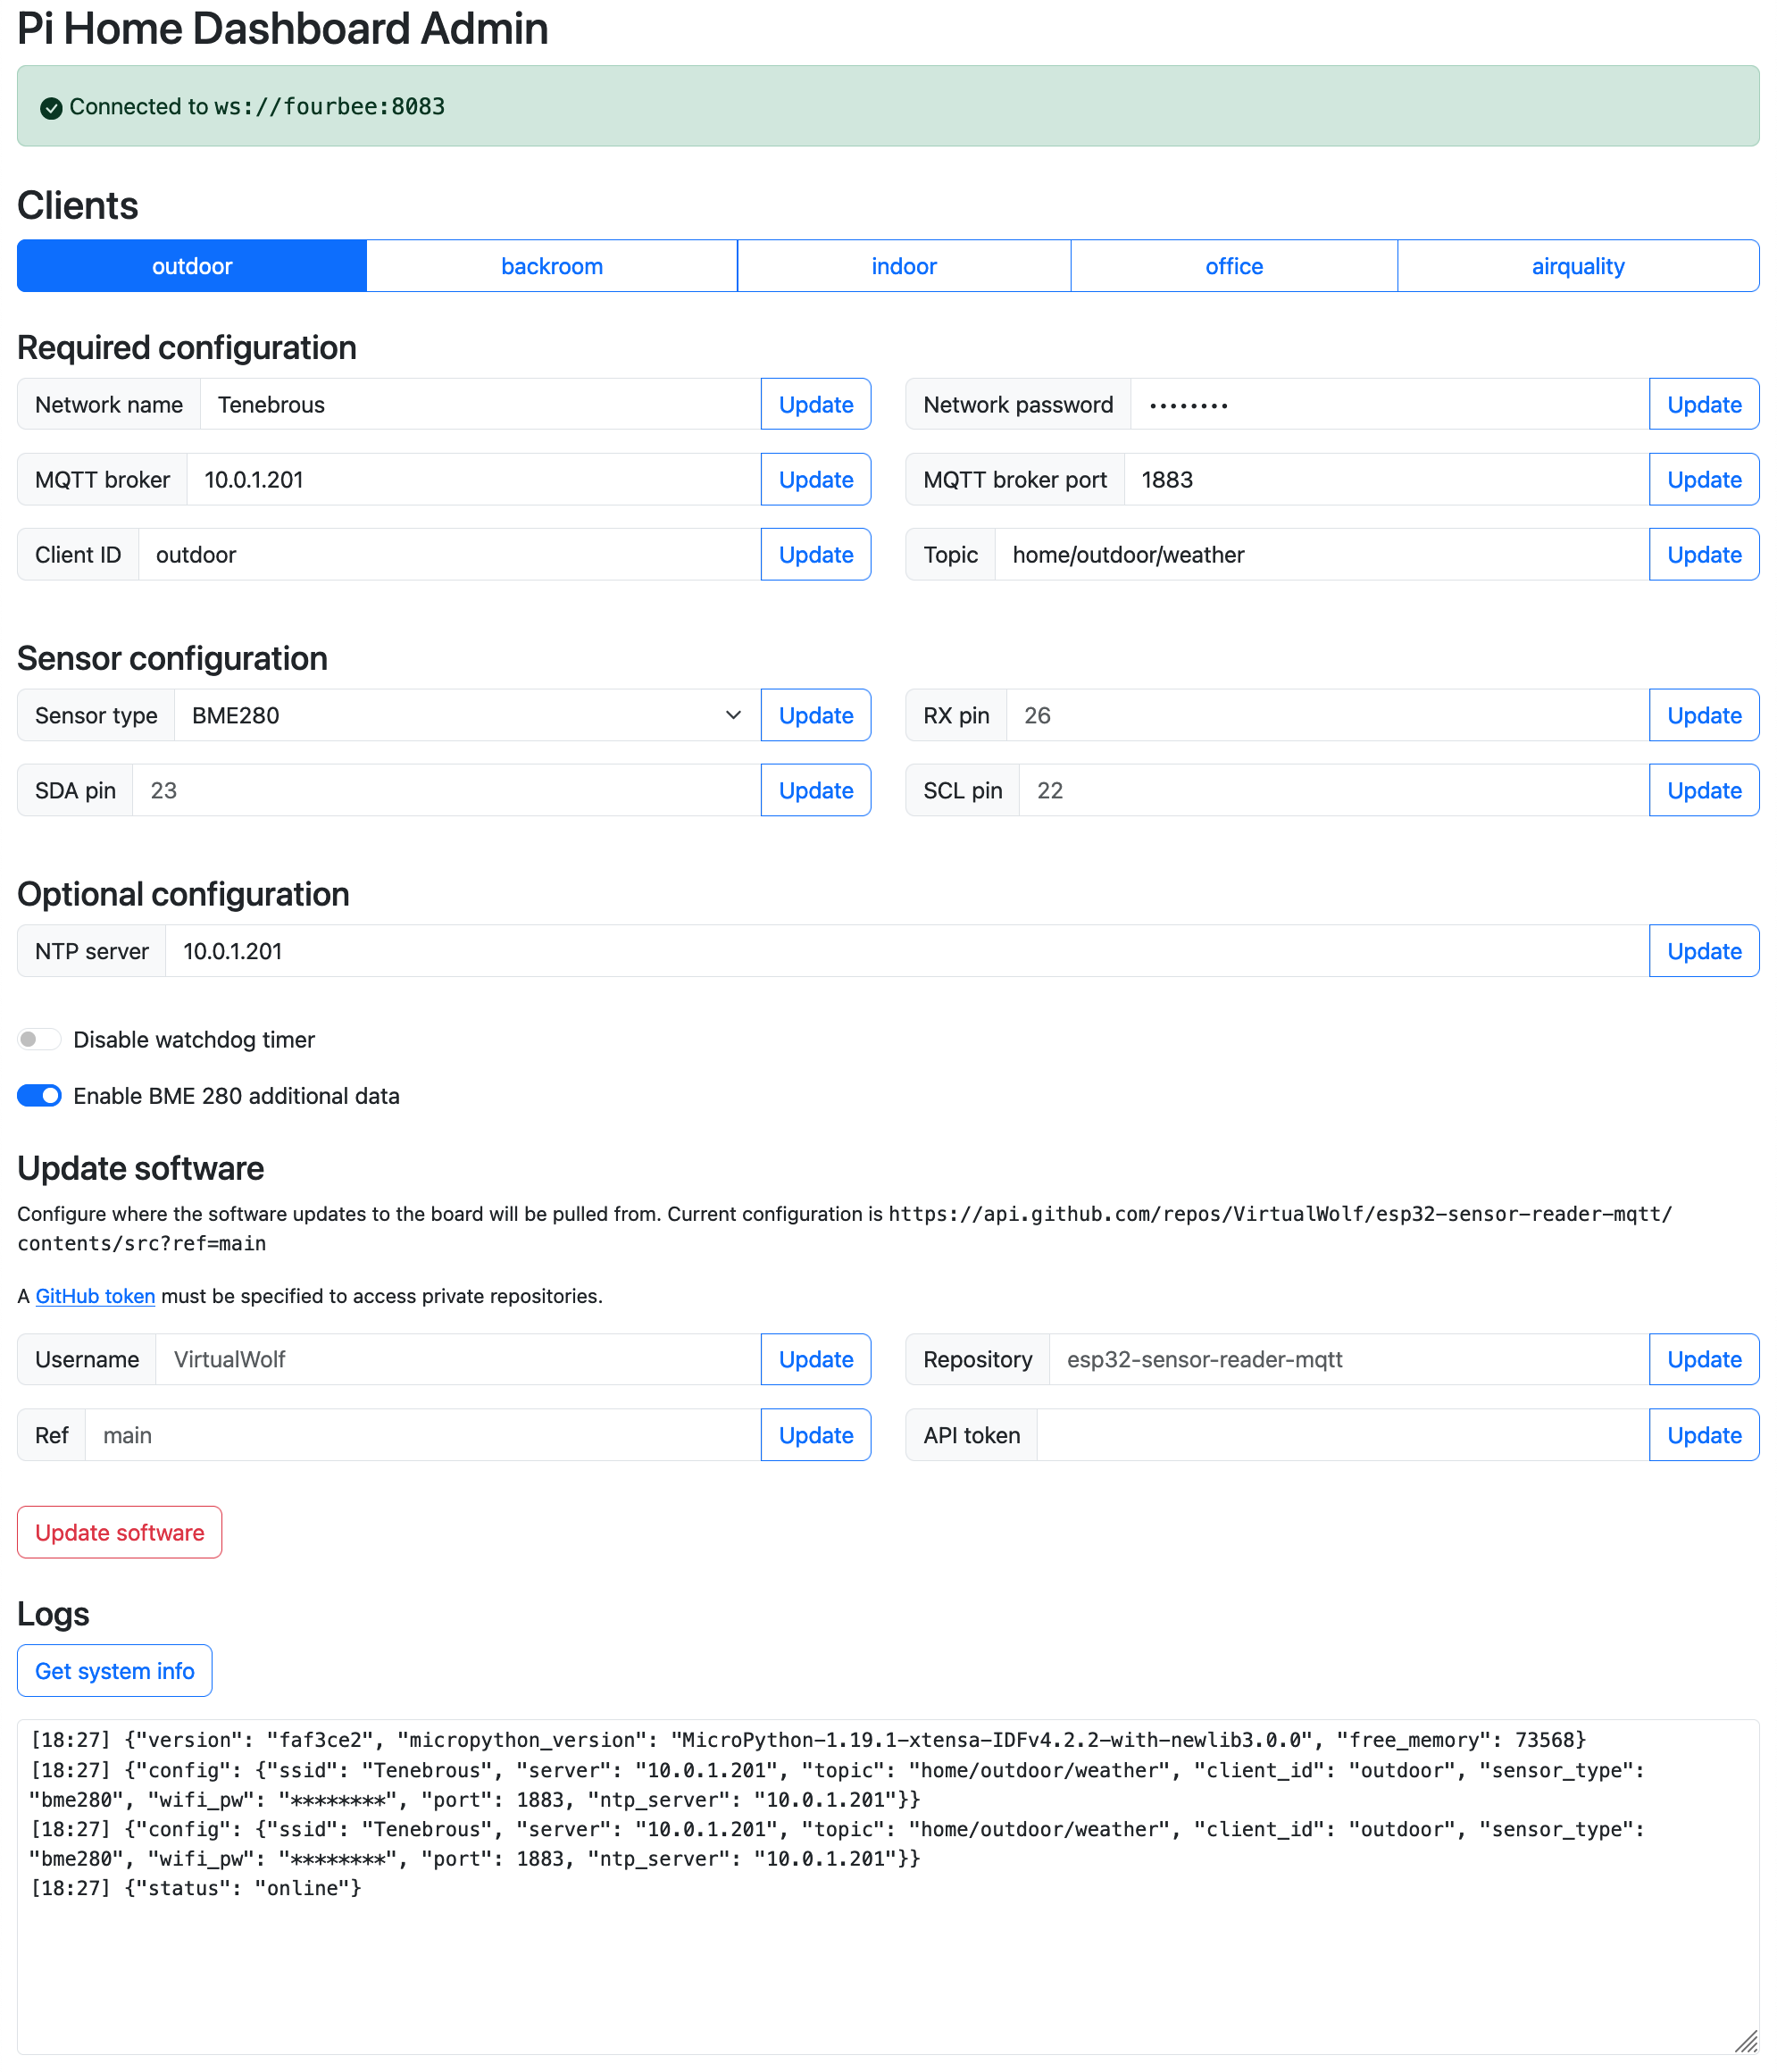
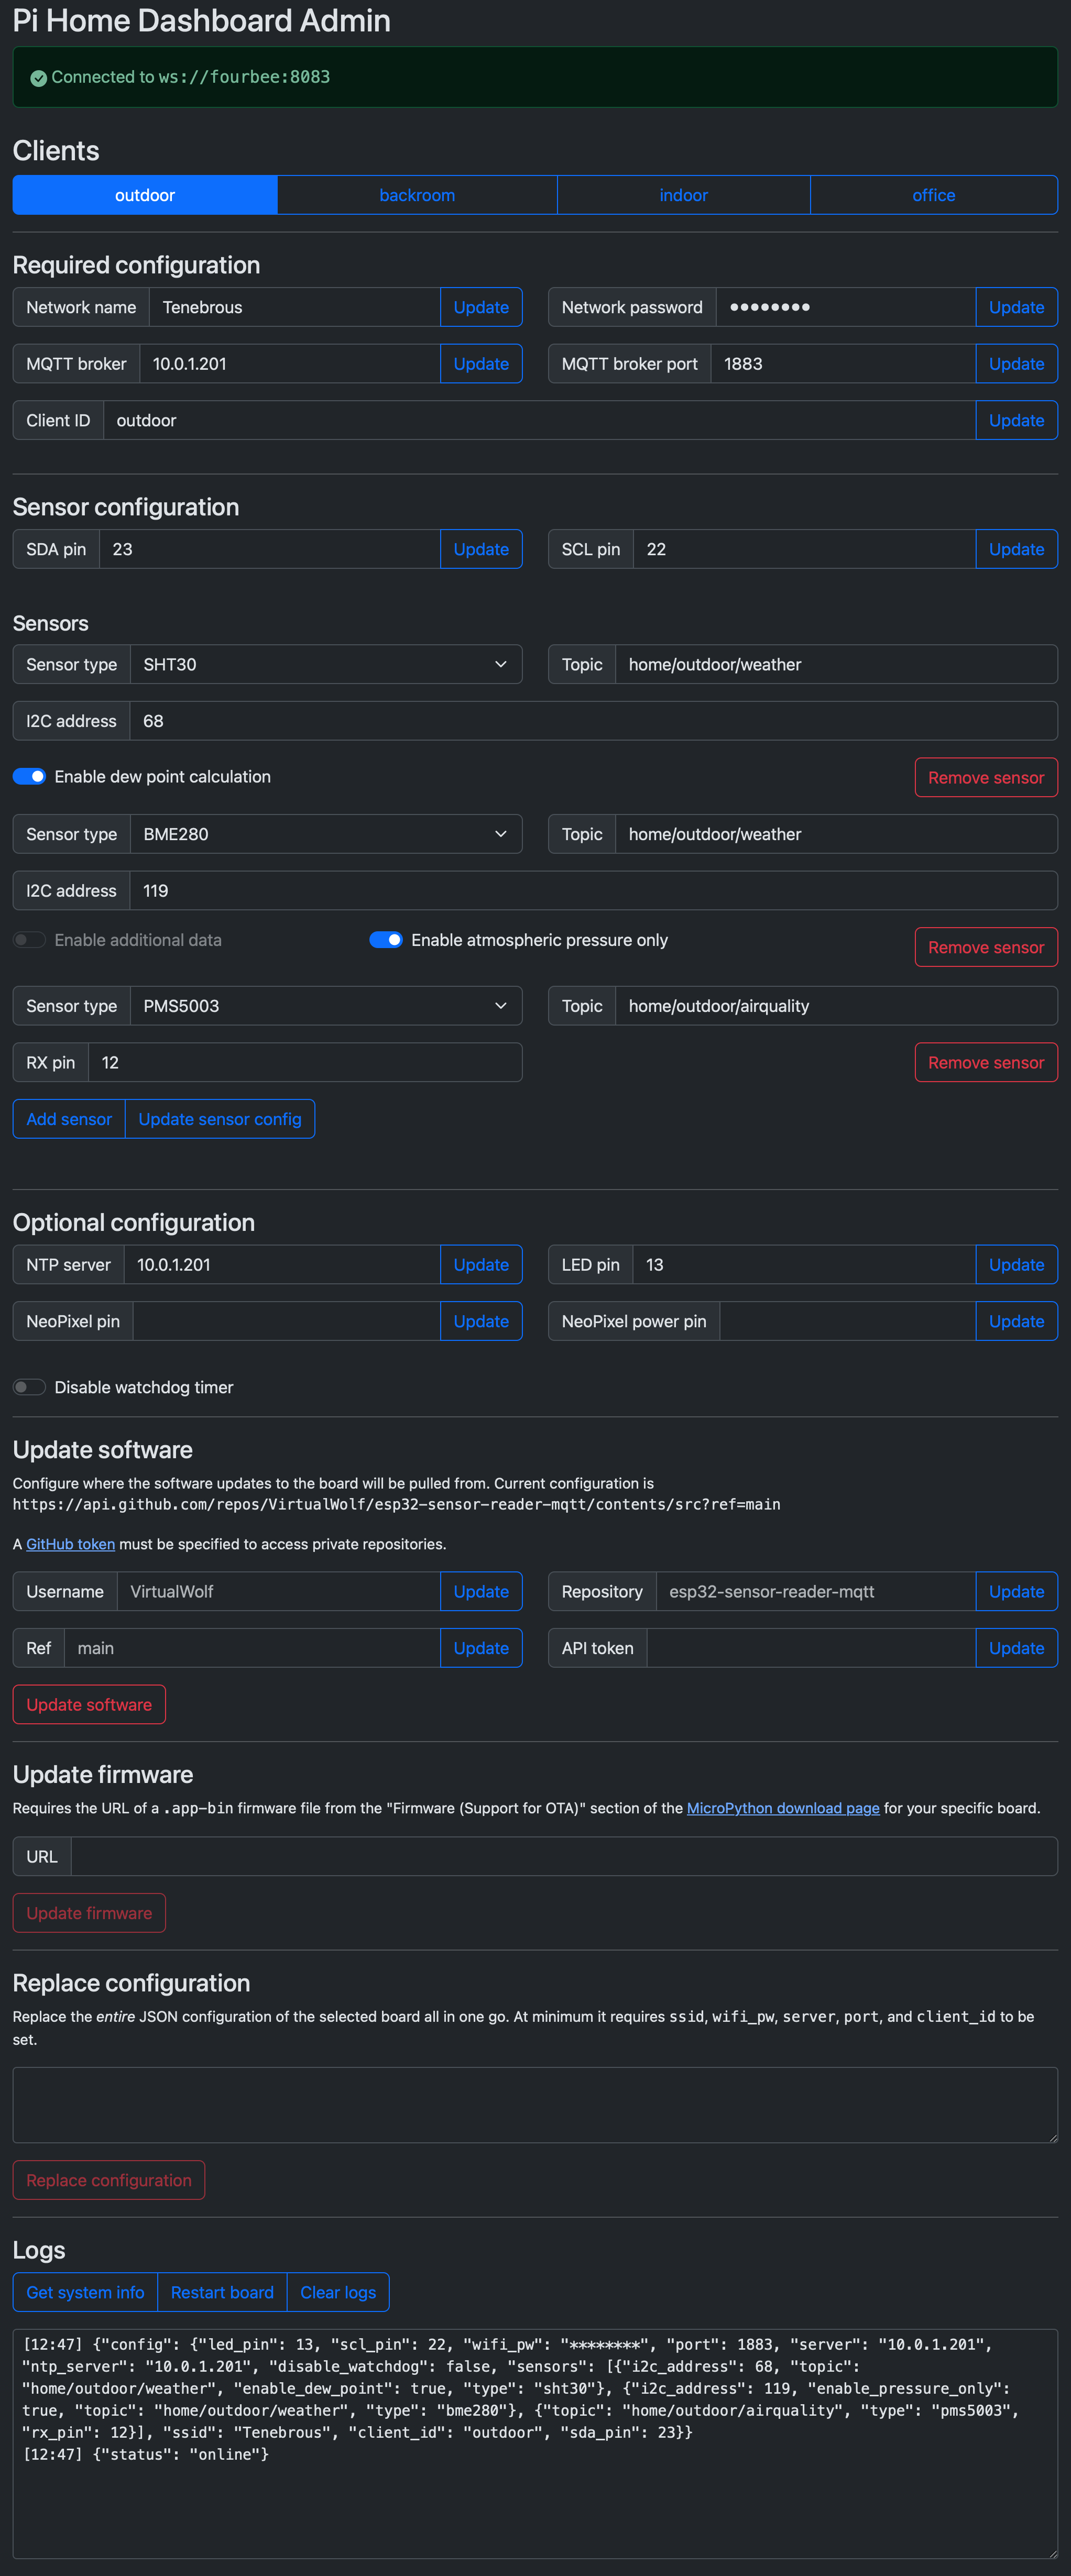
With all of the changes I made to the ESP32 admin page to account for the additional options (including software and firmware updates), it’s rather significantly longer now:
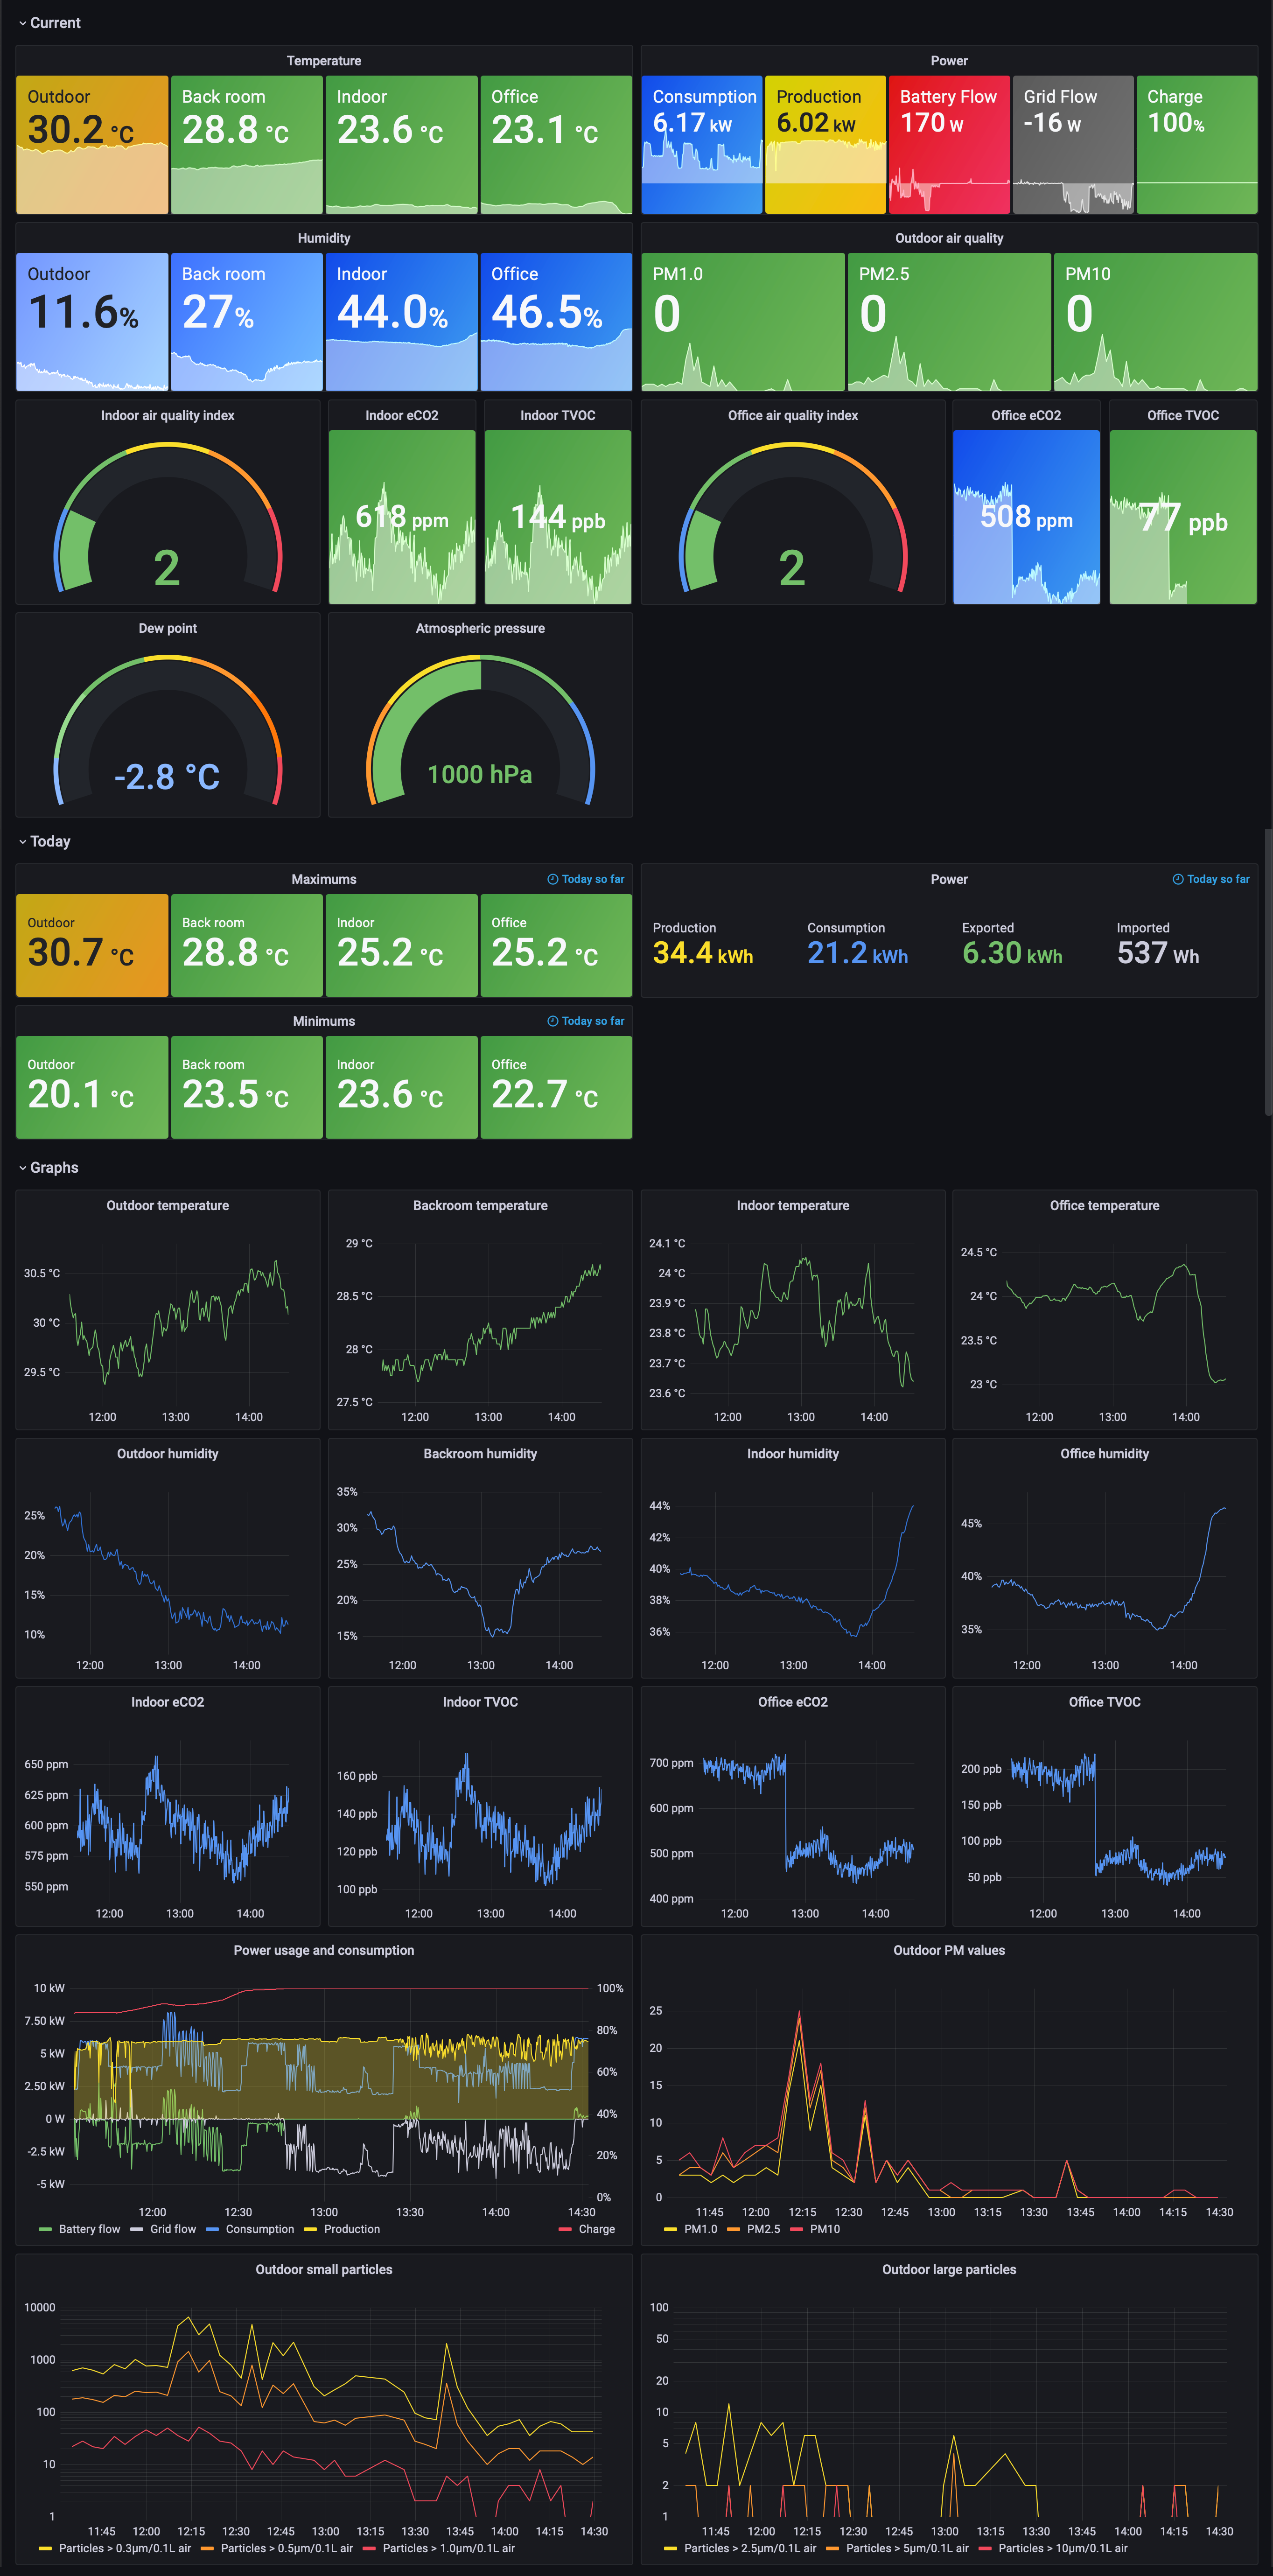
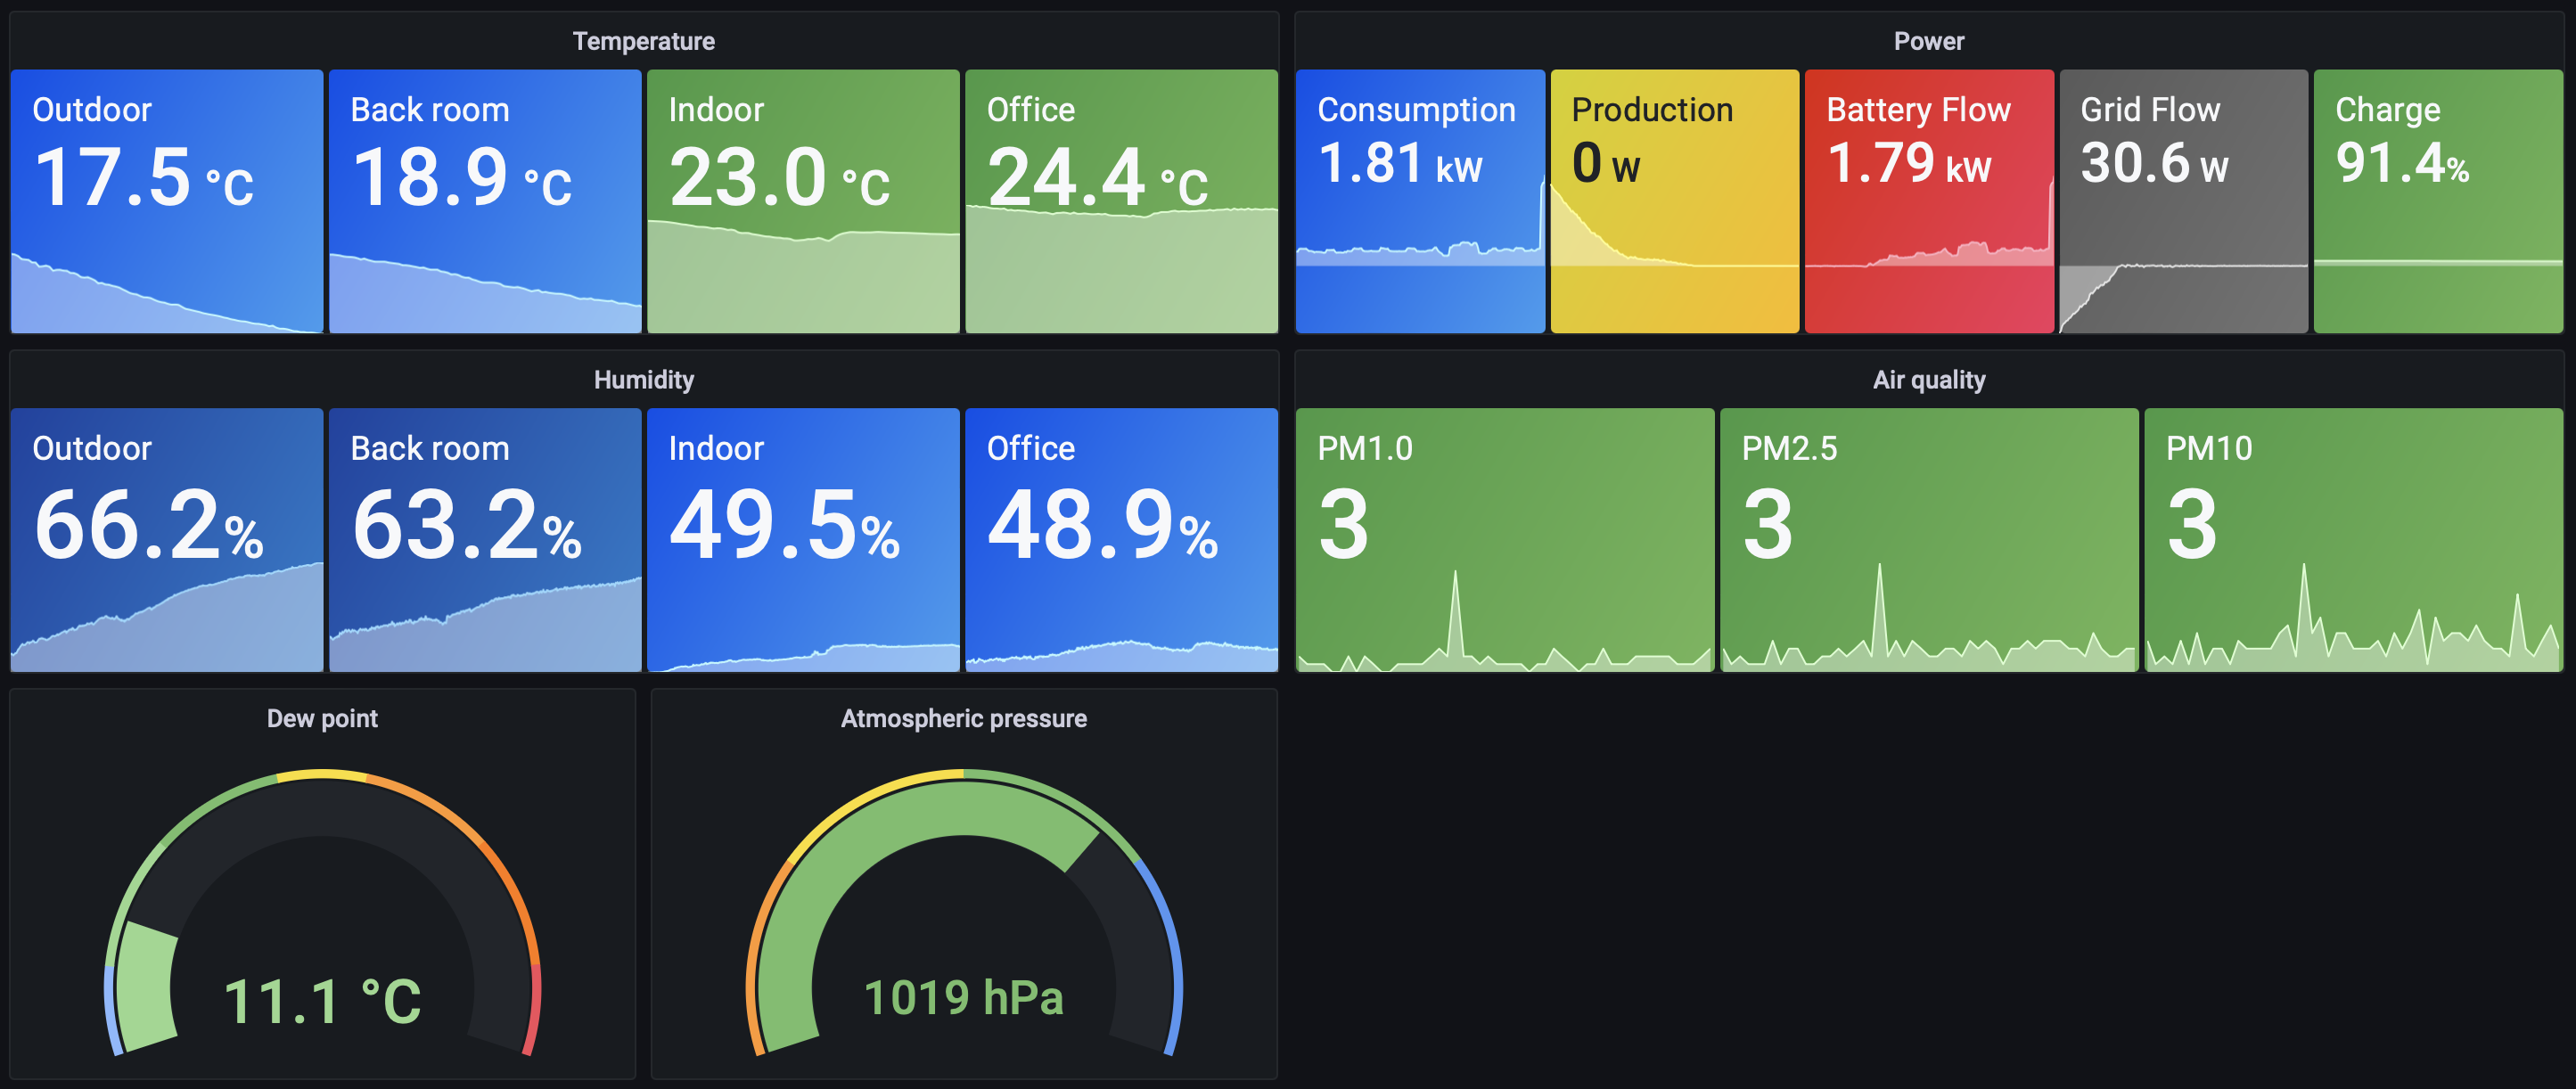
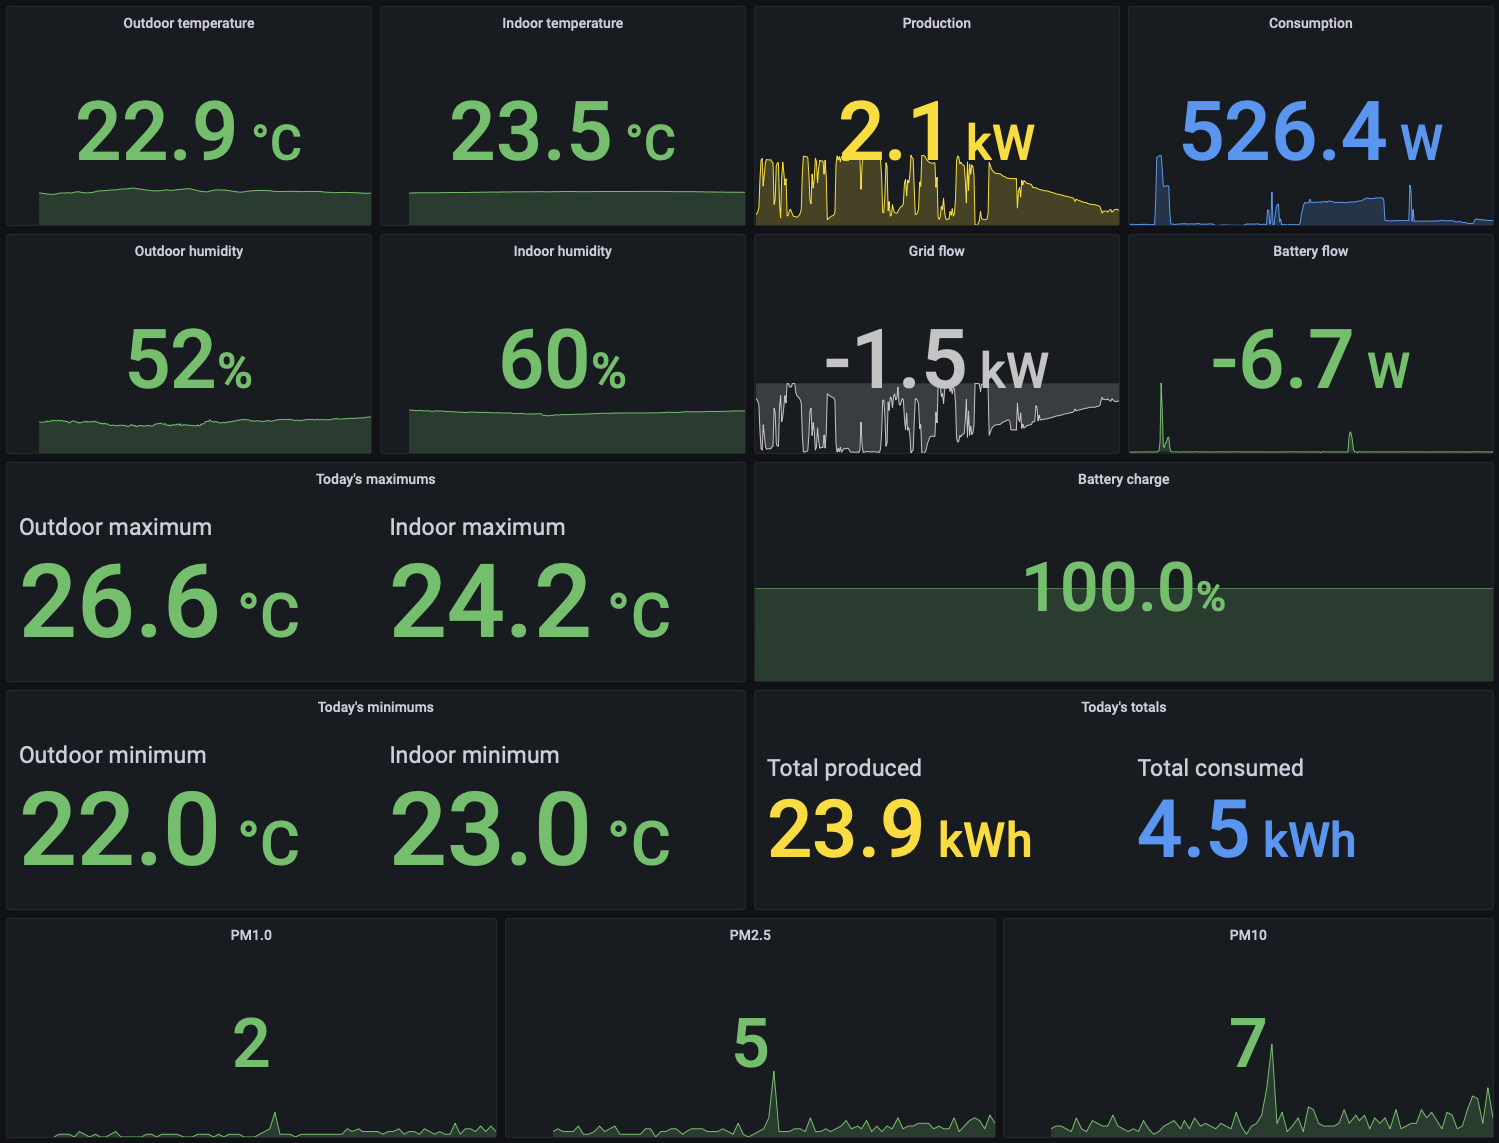
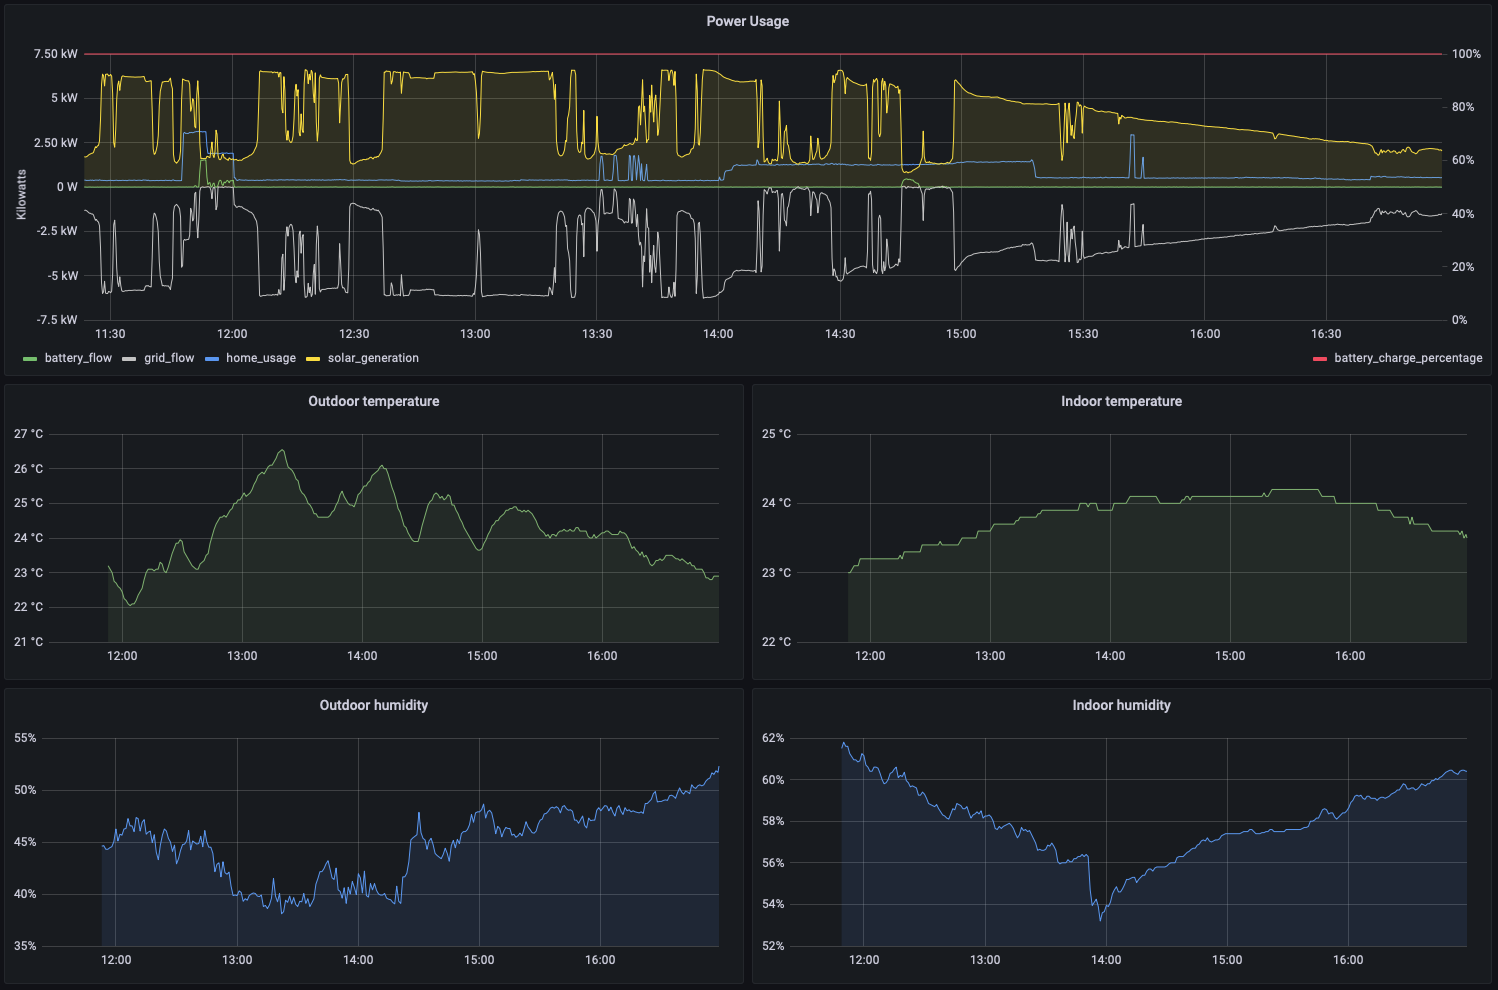
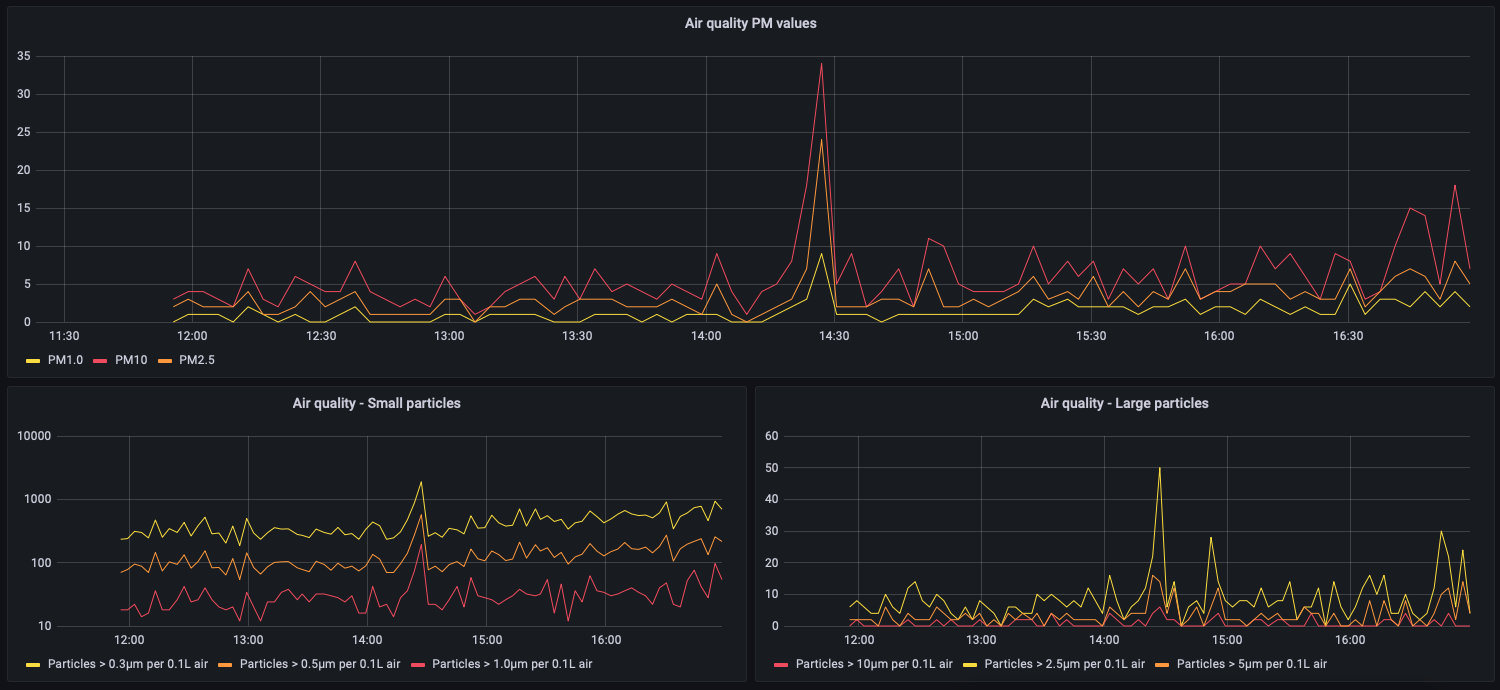
And my Grafana dashboard has gotten equally elaborate!