I posted back in March about our our shiny new solar panels and efforts to reduce our power usage, and as of two weeks ago our net electricity grid power usage is now next to zero thanks to a fancy new Tesla Powerwall 2 battery!
We originally weren’t planning on getting a battery back when we got our solar panels — and to to be honest they still don’t make financial sense in terms of a return on investment — but we had nine months of power usage data and I could see that for the most part the amount of energy the Powerwall can store would be enough for us to avoid having to draw nearly anything whatsoever from the grid*.
* Technically this isn’t strictly true, keep reading to see why.
My thinking was, we’re producing stonking amounts of solar power and are feeding it back to the grid at 7c/kWh, but have to buy power from the grid after the sun goes down at 21c/kWh. Why not store as much as possible of that for use during the night?
The installation was done by the same people who did the solar panels, Penrith Solar Centre, and as before, I cannot recommend them highly enough. Everything was done amazingly neatly and tidily, it all works a treat, and they fully cleaned up after themselves when they were done.
We have 3-phase power and the solar panels are connected to all three phases (⅓ of the panels are connected individually to each phase) and the Powerwall has only a single-phase inverter so is only connected to one phase, but the way it handles everything is quite clever: even though it can only discharge on one phase, it has current transformers attached to the other two phases so it can see how much is flowing through there, and it’ll discharge on its phase an amount equal to the power being drawn on the other two phases (up to its maximum output of 5kW anyway) to balance out what’s being used. The end result is that the electricity company sees us feeding in the same amount as we’re drawing, and thanks to the magic of net-metering it all balances out to next to zero! This page on Solar Quotes is a good explanation of how it works.
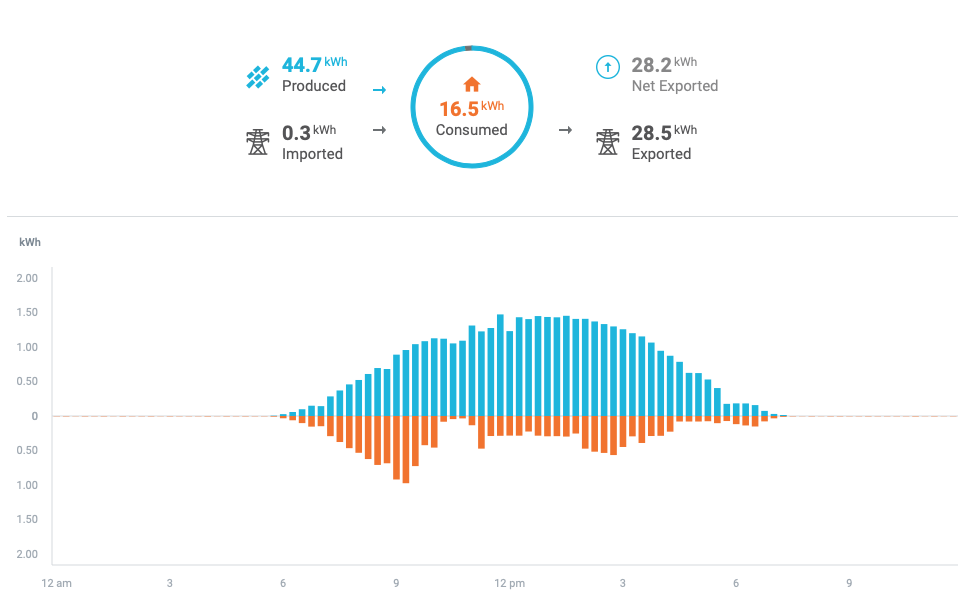
The other interesting side-effect is that when the sun is shining and the battery is charging, it’s actually pulling power from the grid to charge itself, but only as much as we’re producing from the solar panels. Because the Enphase monitoring system doesn’t know about the battery, it gives us some amusing-looking graphs whereby the morning shows exactly the same amount of consumption as production up until the battery is fully-charged!
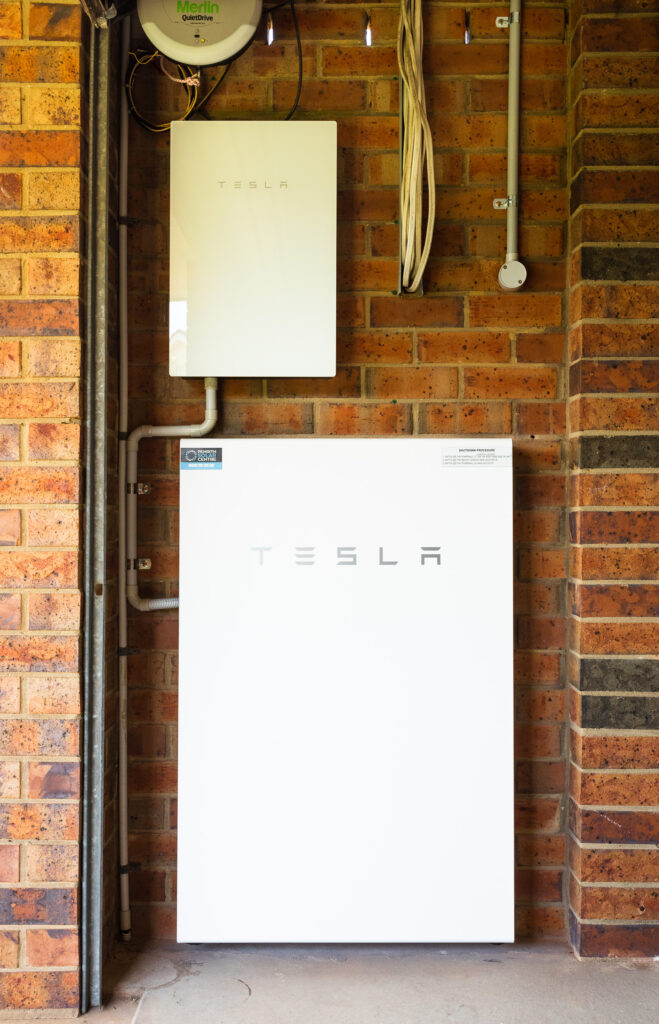
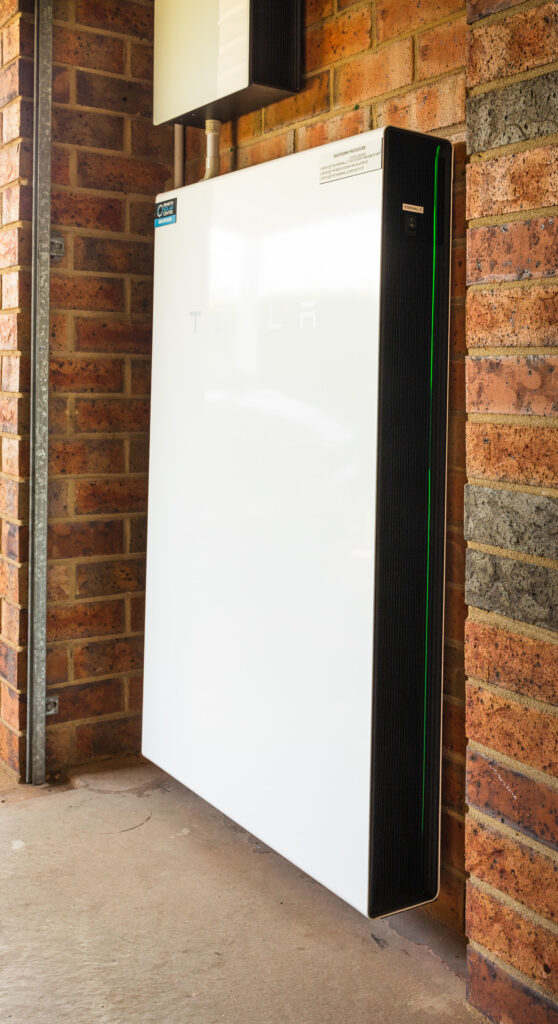
We also have the Powerwall’s “Backup Gateway”, which is the smaller white box in the photos at the top of this post. In the event of a blackout, it’ll instantaneously switch over to powering us from the battery, so it’s essentially a UPS for the house! Again, 3-phase complicates this slightly and the Powerwall’s single-phase inverter means that we can only have a single phase backed up, but the lights and all the powerpoints in the house (which includes the fridge) are connected to the backed-up phase. The only things that aren’t backed up are the hot water system, air conditioning, oven, and stove, all of which draw stupendous amounts of power and will quickly drain a battery anyway.
We also can’t charge the battery off the solar panels during a blackout… it is possible to set it up like that, but there needs to be a backup power line going back from a third of the solar panels back to the battery, which we didn’t get installed when we had the panels put in in February. There was a “Are you planning on getting a battery in the next six months” question which we said no to. 😛 If we’d said yes, they would have installed the backup line at the time; it’s still possible to install it now, but at the cost of several thousand dollars because they need to come out and pull the panels up and physically add the wiring. Blackouts are not remotely a concern here anyway, so that’s fine.
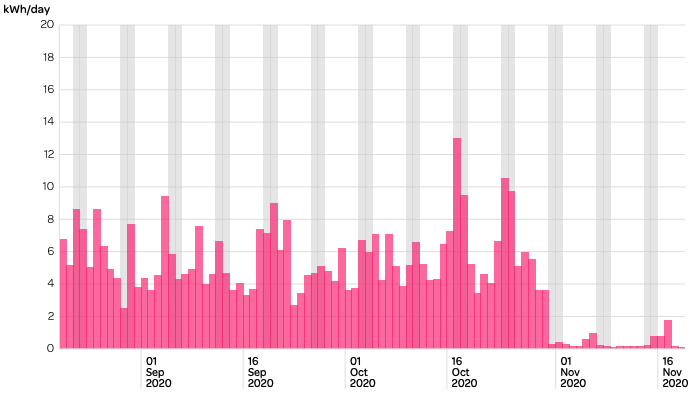
In the post back in March, I included three screenshots of the heatmap of our power usage, and the post-solar-installation one had the middle of the day completely black. Spot in the graph where we had the battery installed!
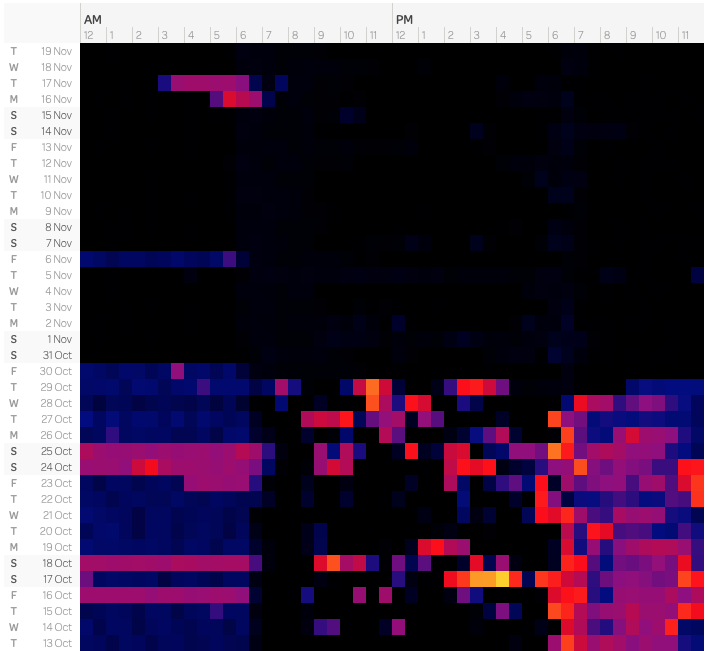
We ran out of battery power on the 6th of November because the previous day had been extremely dark and cloudy and we weren’t able to fully charge the battery from the solar panels that day (it was cloudy enough that almost every scrap of solar power we generated went to just powering the house, with next to nothing left over to put into the battery), and the 16th and 17th were both days where it was hot enough that we had the aircon running the whole evening after the sun went down and all night as well.
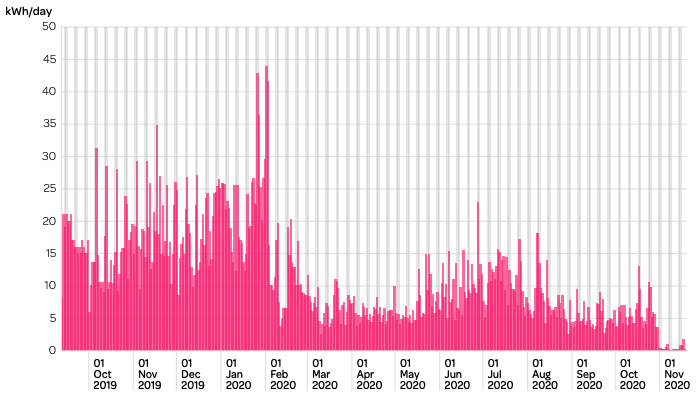
Powershop’s average daily use graph is pretty funny now as well.
And even more so when you look all the way back to when we first had the smart meter installed, pre-solar!
For monitoring the Powerwall itself, you use Tesla’s very slick app where you can see the power flow in real time. When the battery is actively charging or discharging, there’s an additional line going to or from the Powerwall icon to wherever it’s charging or discharging to or from.
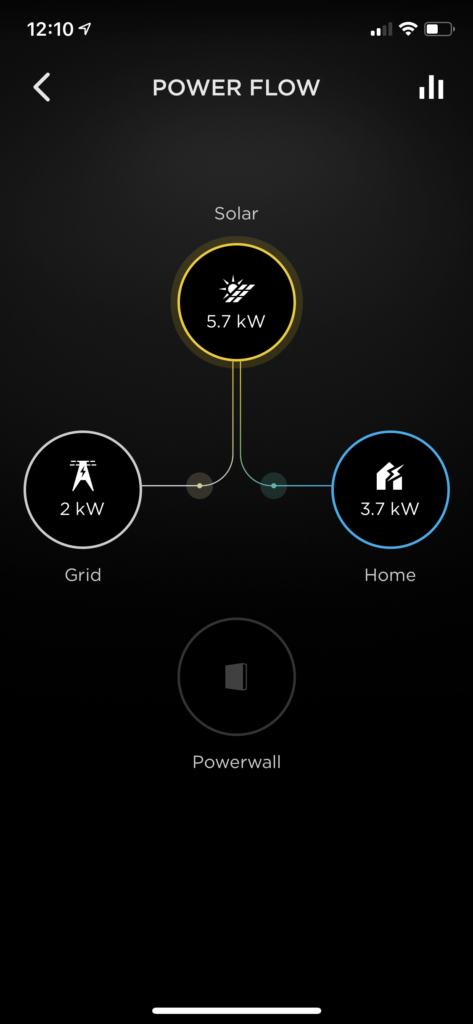
You can’t tell from a screenshot of course, but those on the lines connecting the Solar to the Home and Grid icons animate in the direction that the power is flowing.
It also includes some historical graph data as well, but unfortunately it’s not quite as nice as Enphase’s, and doesn’t even have a website, you can only view it in the app. There’s a website called PVOutput that you can send your solar data to, and we have been doing that via Enphase since we got the solar panels installed, but the Powerwall also has its own local API you can hit to scrape the power usage and flows, and battery charge percentage. I originally found this Python script to do exactly that, but a) I always struggle to get anything related to Python working, and b) the SQLite database that it saves its data into kept intermittently getting corrupted, and the only way I’d know about it is by checking PVOutput and seeing that we hadn’t had any updates for hours.
So, I wrote my own in TypeScript! It saves the data into PostgreSQL, so far it’s been working a treat and it’s all self-contained in a Docker container. The graphs live here, and to see the power consumption and grid and battery flow details, click on the right-most little square underneath the “Prev Day” and “Next Day” links under the graph. Eventually I’m going to send all this data to my website so I can store it all there, but for the moment PVOutput is working well.
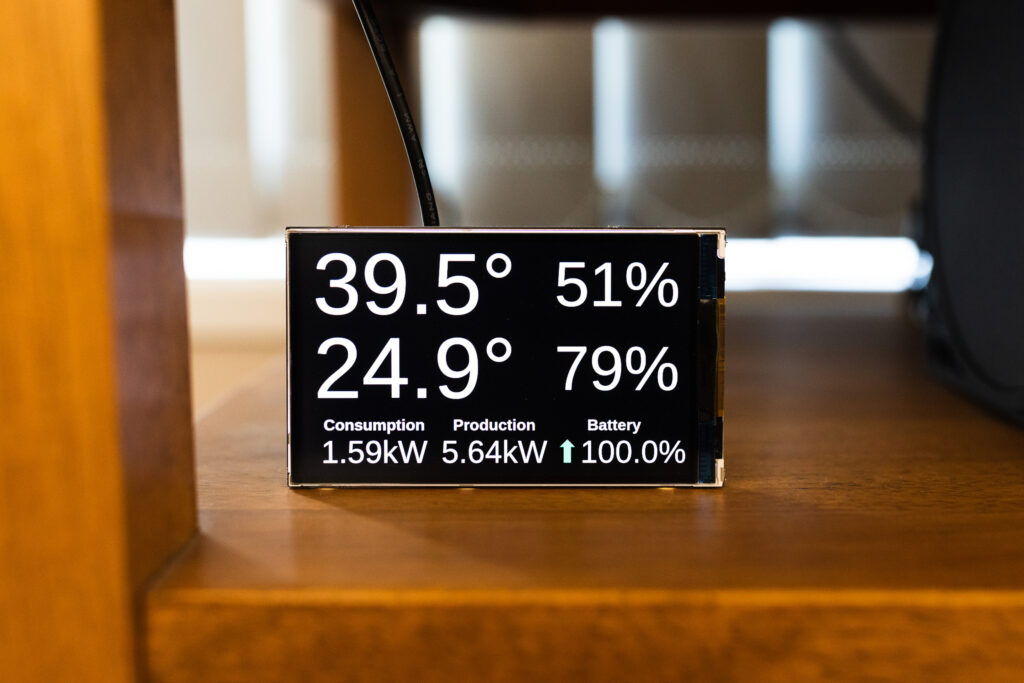
It also won’t shock anybody to know that I updated my little Raspberry Pi temperature/power display to also include the battery charge and whether it’s charging or discharging (charging has a green upwards arrow next to it, discharging has a red downwards arrow).
My only complaint with the local API is that it’ll randomly become unavailable for periods of time, sometimes up to an hour. I have no idea why, but when this happens the data in the Tesla iPhone app itself is still being updated properly. It’s not a big deal, and doesn’t actually affect anything with regards to battery’s functionality.
Overall, we’re exceedingly happy with our purchase, and it’s definitely looking like batteries in general are going to be a significant part of the electrical grid as we move to higher and higher percentages of renewables!