I posted of my woes with reliably syncing music onto my iPhone back in October last year, and after I had written that post I discovered an additional irritation in that a bunch of random albums just… didn’t have their album artwork showing when viewed on my iPhone. The art was there in iTunes, it was there embedded in the damn music file, but the iPhone just stubbornly refused to show it even after another full remove-all-the-music-and-resync (which took well over twelve hours — ?!? — because apparently iTunes won’t transcode and then sync more than one single file at once and it does them in serial). I even nuked the iTunes artwork cache and rebuilt it then resynced, to no avail. At this point I decided I wanted to seriously start looking at alternatives.
I had already been dabbling a little bit with Navidrome, although it seemed like it was a lot more focused on streaming rather than what I wanted to do (have all my music synced to my iPhone so I didn’t need to rely on a decent internet connection when listening to music during my commute). Navidrome uses the OpenSubsonic API and so any client that uses that protocol can talk to it, and it turns out that the API has a download endpoint and you can have it set up whereby that download will be transcoded to a smaller format first, which is great because an increasingly-large portion of my music library is lossless and so it won’t actually fit on my phone anymore. At this point I figured I’d go ahead and see about migrating for real.
Initial music import
Navidrome is quite simple, you point it at a directory of music and it’ll read all the metadata for album/artist/etc. and give you a nice shiny UI to listen to it with. It has no ability to make any changes to the music files and is strictly read-only, so I started out by simply pointing it to the existing music directory on my laptop and seeing what happened.
The first obvious thing to check was to compare the number of songs that iTunes reported and the number that Navidrome had picked up, and these did not actually match! I poked around and discovered two reasons for this. First and most obvious, there were a couple of albums that I somehow had sitting my music directory that hadn’t been added to iTunes, but of course Navidrome happily picked up. 🤦🏻♀️
Secondly, there were a number of random files that had a .m4p extension, which is the extension that iTunes used for the old DRM-protected music files that you used to buy from the iTunes Store before Apple did away with DRMing them. Navidrome saw this extension and was like “Nope, not even going to try to read this!”
I definitely did not have any DRM music left, I’d redownloaded all my DRMed stuff and replaced it with better quality non-DRM files pretty much as soon as Apple allowed that, but for some reason some (but not all!) of the files’ extensions had remained as .m4p. A quick rename to .m4a and Navidrome happily picked those files up, and at this point the song counts between iTunes and Navidrome matched.
Importing play counts and ratings from iTunes
Similar to iTunes, Navidrome keeps track of play counts across individual songs and supports ratings and favouriting items, but Navidrome also aggregates up to the album and artist level so you can see how many plays of a given album or overall artist you’ve had. My next order of business was figuring out how to get my play counts and ratings imported from iTunes into Navidrome, because I’ve been using iTunes for my music ever since I got my original iPod way back in 2001 and I didn’t want to lose all that history.
Given Navidrome is open source I figured someone had to have written something so I went digging, and found a Python script from three years ago that someone had written to take the XML export of an iTunes library, read it, and write that data into the SQLite file that Navidrome uses. It didn’t actually work because Navidrome’s database structure had changed between the version of Navidrome that the script had been written to run against and what was current, but it was a good excuse to do some Python hacking. Over the course of quite a few weeks’ worth of evenings I got it working and made a number of improvements, plus tidied up the code and added a lot of clarifying comments to explain what was going on, and have published the code over on Codeberg.
The main issue I ran into when I ran it against my full music library was XML encoding problems with file names, I described this in the README and how to work around them, but otherwise it was quite seamless once I’d worked out all the kinks in the script itself.
Sound Check and ReplayGain
iTunes has long had an option called “Sound Check” that you can enable that analyses the actual loudness of every song and then adds a tag into that song file to tell iTunes how much to adjust the playback volume by so your whole library plays back at the same relative loudness. This is extra good when you tend to listen to your whole library on shuffle like I do where albums from different eras were mastered at different volumes: Sound Check saves you from having your ears blasted out when a song that’s much louder than another comes on and you have to scramble to adjust the volume down (and then back up when a quiet song comes on, and so on).
There’s a thing called ReplayGain that does the same thing as Sound Check but better and more accurately, and I have long been using a piece of software called iVolume that analyses your music using ReplayGain then overwrites iTunes’ own Sound Check tag with the ReplayGain value. That tag is an iTunes-specific thing and not any sort of standard that any other player uses (because of course), so I needed to run my whole music library through something that would update the files with the actual ReplayGain tag that players will read.
It turns out there are quite a few options to choose from, I ended up using the rsgain command line utility installed via Homebrew and letting it loose it in easy mode against my entire music directory. And as I subsequently discovered later on, MusicBrainz Picard has a plugin system and one of those plugins is called “ReplayGain 2.0” which will use your rsgain installation and allows you to generate the ReplayGain tags as part of updating the rest of the metadata.
Mobile client apps
On desktop I can just use Navidrome’s UI, but I needed a mobile client for when I’m commuting or just otherwise out of the house and listening to music. The first batch I found were quite janky open-source-feeling ones, but then I discovered first Nautiline which actually feels like a properly native iOS app, and then subsequently Arpeggi. Both are highly recommended if you’re on iPhone or iPad.
Transcoding
Because my music library has quite a few lossless files in it, I can’t just actually fit my whole library onto my phone anymore without transcoding to a smaller lossy format.
(Before anything else, since it’s the machine that Navidrome is running on that’s responsible for the transcoding, you need to have ffmpeg installed, brew install ffmpeg will do the trick if you’re using Homebrew.)
Navidrome has a number of options for controlling transcoding, but it’s very confusing because the client app you’re using also can set options, and it’s been rather difficult to figure out the exact incantation of options configured everywhere to do what I want, namely always transcode to Opus at around 160Kbps and download in that same format.
For Navidrome itself, the only configuration setting I’ve tweaked has been to set the AutoTranscodeDownload option to true. The client side is more confusing though, because there are separate options for downloading, plus transcoding based on whether you’re on a mobile connection or wifi and a lot of the transcoding decision seems to come down to the client app’s request.
In Arpeggi, I’ve gotten it working how I want by going into the Playback settings and setting the “Cache Type” to “Download”, and the “Cellular” and “WiFi” options under “Transcoding” to both be Opus at 160Kbps, with the “Only transcode lossless files” option off.
For Nautiline, the magic configuration seems to be going into Settings > Transcoding, setting the Format to “Opus”, the “Connection Quality” for both Cellular and Wi-Fi to “Low”, then configuring both High Quality and Low Quality to 160Kbps and “Transcode Lossless” under “High Quality” to be “Always”. Then under Settings > Downloads & Cache, “Transcode Lossless” should be on.
Running Navidrome as a service
Up until this point I had been running Navidrome just on my local laptop by manually running the navidrome executable in a terminal window, but to actually move this into “production” as it were, Navidrome would need to be running a service at all times on our home server Mac mini, and all the music files would need to be transferred to it as well.
I copied across all of the music via rsync, plus the Navidrome SQLite database file containing my imported iTunes data, fired up Navidrome on the Mini and added it as a server in my iOS client app, but when I tried to play music… nothing happened. After a bunch of confusion, I figured out what was going on: VNCing into the Mac mini revealed that it was sitting at the “Do you want to allow navidrome access to removable disks?” prompt, because all of the music was on the external hard disk attached to the Mac mini, and until I clicked yes Navidrome couldn’t actually read the files. 🤦🏻♀️ I also discovered that this gets reset on every Navidrome upgrade, so each time Navidrome is upgraded it’ll require another trip into VNC to allow it to access the external drive.
With that out of the way, it was time to keep Navidrome itself up and running, and launched at boot. The Navidrome installation instructions for macOS helpfully include an example LaunchAgent plist file you can use, but when running it like this I found that the location that Homebrew installed ffmpeg into wasn’t actually in the $PATH that Navidrome uses so it wasn’t able to transcode anything. Navidrome has a specific FFmpegPath configuration option that can be set in the configuration file, so I just pointed that at the ffmpeg executable (/opt/homebrew/bin/ffmpeg in my case).
I also discovered that the trusty old launchctl load and launchctl unload commands to start and stop a LaunchAgent are actually considered “legacy” and there’s a new and significantly more confusing way of doing it. This blog post has a good overview, but the tl;dr is:
- Use
launchctl bootstrap gui/$(id -u) <PATH_TO_PLIST> to start a LaunchAgent
- Use
launchctl bootout gui/$(id -u) <PATH_TO_PLIST> to stop it
To save myself having to remember this ridiculous incantation, I wrote a quick shell script called navidromectl and call it with navidromectl start or navidromectl stop:
#!/usr/bin/env bash

if [[ $# -eq 0 ]] ; then
    echo "Usage: navidromectl [start|stop]"
    exit 1
fi

ACTION=$1

case $ACTION in
    "start")
        launchctl bootstrap gui/$(id -u) ~/Library/LaunchAgents/navidrome.plist
        ;;
    "stop")
        launchctl bootout gui/$(id -u) ~/Library/LaunchAgents/navidrome.plist
        ;;
esac
Automatically organising newly-imported music
iTunes has a pair of options, “Copy files to Media folder when adding to library” and “Keep Media folder organised” that when enabled mean that files added to iTunes will be copied to wherever your music is stored and automatically sorted into an $ARTIST/$ALBUM folder structure, with the files themselves named as $TRACK_NUMBER $TITLE. I wanted some way of replicating this once I was fully on Navidrome, but since Navidrome is read-only and does no organisation of anything on its own, I would need some other solution.
I went digging and discovered this frankly ridiculous Python package called Beets. It does basically everything and the kitchen sink, and has a whole system to write your own plugins as well in case it doesn’t do what you need it to. As well as doing the automatic organisation and file naming I was after, it can also fetch file metadata from MusicBrainz (the same as what I’m doing with MusicBrainz Picard), calculate ReplayGain values, and write it all to the files before it organises them.
I didn’t actually need the vast majority of what it does, but it does do the things I need it to well (i.e. point it at an “Import” directory and have it automatically move and rename things), and after a bunch of fiddling with configuration options, I’ve settled on this beets.yaml configuration file:
# The directory where the music library lives
directory: /Volumes/Multifarious/Music/virtualwolf
library: ~/Library/Application Support/beets/library.db

# This is required for the disc_and_track template below
# to work
plugins:
  - inline

item_fields:
  # Include the disc number at the beginning of the
  # filename ONLY if there is more than one disc
  disc_and_track: f"{disc:01d}-{track:02d}" if disctotal > 1 else f"{track:02d}"

# Set the desired file and folder organisation
paths:
  default: $albumartist/$album%aunique{}/$disc_and_track $title
  comp: Compilations/$album%aunique{}/$disc_and_track $title

import:
  log: ~/Library/Application Support/beets/beets.log
  quiet: true

  # This is important to allow the "Import anything
  # dropped into this directory" workflow
  incremental: true

  # Don't write any tags to files
  autotag: false

  # Move the files from the import directory
  move: true

  # Don't write tag changes to files since I'm handling
  # that with MusicBrainz Picard earlier
  write: false
The last missing magic ingredient here was the ability to automatically have Beets run when I drop music into the Import directory (with the setup above, I’d need to SSH into the Mac mini, activate the Python virtualenv that the beet package is installed in, and then run the import command).
As it turns out, there is a built-in solution in macOS to automatically run a script or perform an action when something is added to a folder: Folder Actions. Firstly the action itself needs to be created, and then it gets attached to a folder.
To create the action, open the Automator application, go File menu > New, and choose “Folder Action”. In the right-hand pane at the top where it says “Folder Action receives files and folders added to” click on “Choose folder” and select the folder that’s going to be using to drop the music into to be auto-imported, then find the “Run Shell Script” action in the left-hand pane and double-click on it to add that action. Set the “Shell” dropdown to /bin/bash, set the “Pass input” dropdown to “as arguments”, and add the beet import command into there. Mine looks like this because I’m also using a virtualenv to install Beets into, and that directory argument to beet import on the second line is the same directory as the “Folder Action receives files and folders added to” dropdown:
. /Users/virtualwolf/Library/Application\ Support/beets/.venv/bin/activate
beet import "/Volumes/Multifarious/Music/Import/"
Save the workflow as “Import Music” or whatever, then in the Finder go to that directory you’ll be using for imports, right-click on it, and go to Services > Folder Actions Set-Up…”, then click “Run Service” at the prompt. It shows a list of actions, one of which will be the shiny new Import Music option. Select that, and job done! Once a directory full of music is dropped into that Import directory, Beets will trigger and automatically grab the files, read their metadata, and move them into the correct locations in your music directory.
One thing to note here is that Beets keeps a log of which directories it’s already imported, in the state.pickle file in its config directory. I was tripped up by this when I was trying to test that everything was working because I was repeatedly using the same directory to test the importing, and once it had been imported by Beets one time, that was it, it would be ignored from then on and I couldn’t figure out out what on earth was going on. So if you’re doing testing, make sure you use unique directory names before you drop them into the import directory that Beets is looking at!
UPDATE: One thing I realised with this is that it falls over if you’re copying files into the Import directory rather than just moving them from another location on the same drive. If you copy them, they don’t all arrive in the Import directory all at once and so as soon as the first file or two have successfully copied over, the folder action triggers, Beets dutifully runs and imports the files that are there, and then ignores the rest when they’re finished. So this is a bit of a two-step process now, I copy onto the drive that all my music lives on, and then move it into the Import directory in one hit so Beets can do its thing.
Smart playlists and one-click downloading
I suspect I’m probably an outlier amongst music-listeners, but I don’t tend to use regular playlists at all. In iTunes I have a handful of smart playlists set up, and by far my most heavily-used one is my “Random” playlist which is every song that I haven’t listened to in the last two years. If I’m not listening to a specific album, typically I’ll just chuck that playlist on shuffle.
Navidrome has the concept of smart playlists as well, though they’re currently in beta and are not currently exposed through the UI, but you can manually create files with the correct syntax, drop them somewhere in the music directory, and they’ll show up.
To recreate my Random playlist, I used this:
{
  "all": [
    { "notInTheLast": { "lastplayed": 730 } }
  ],
  "sort": "lastplayed",
  "comment": "All songs that have not been played in the last two years."
}
The other thing I wanted was an easy way to just download (and thus transcode) everything from Navidrome into my mobile client app. There isn’t any direct way to do that in either Nautiline or Arpeggi, but creating a smart playlist that lists every single song did the trick:
{
  "all": [{ "gt": { "playCount": -1 } }],
  "sort": "album",
  "comment": "Every single song, to one-click download for offline listening."
}
Opening that playlist then downloading the contents worked a treat, and as a bonus Arpeggi has an “Auto-download” option for playlists, so as soon as new music is imported into Navidrome, Arpeggi picks that up and downloads those new songs!
Making Navidrome accessible from outside the local network
The very last piece that I needed to set up was making it possible to access Navidrome outside of our local network. I didn’t want to expose it directly to the internet via port forwarding, but I also couldn’t set up Wireguard so my devices could VPN in because I wanted to be able to access Navidrome via my work machine so I can listen to music on my fancy speakers while working, and my workplace uses Cloudflare WARP which is Wireguard under the covers (and I suspect the security team would very much frown on me running a VPN to somewhere random).
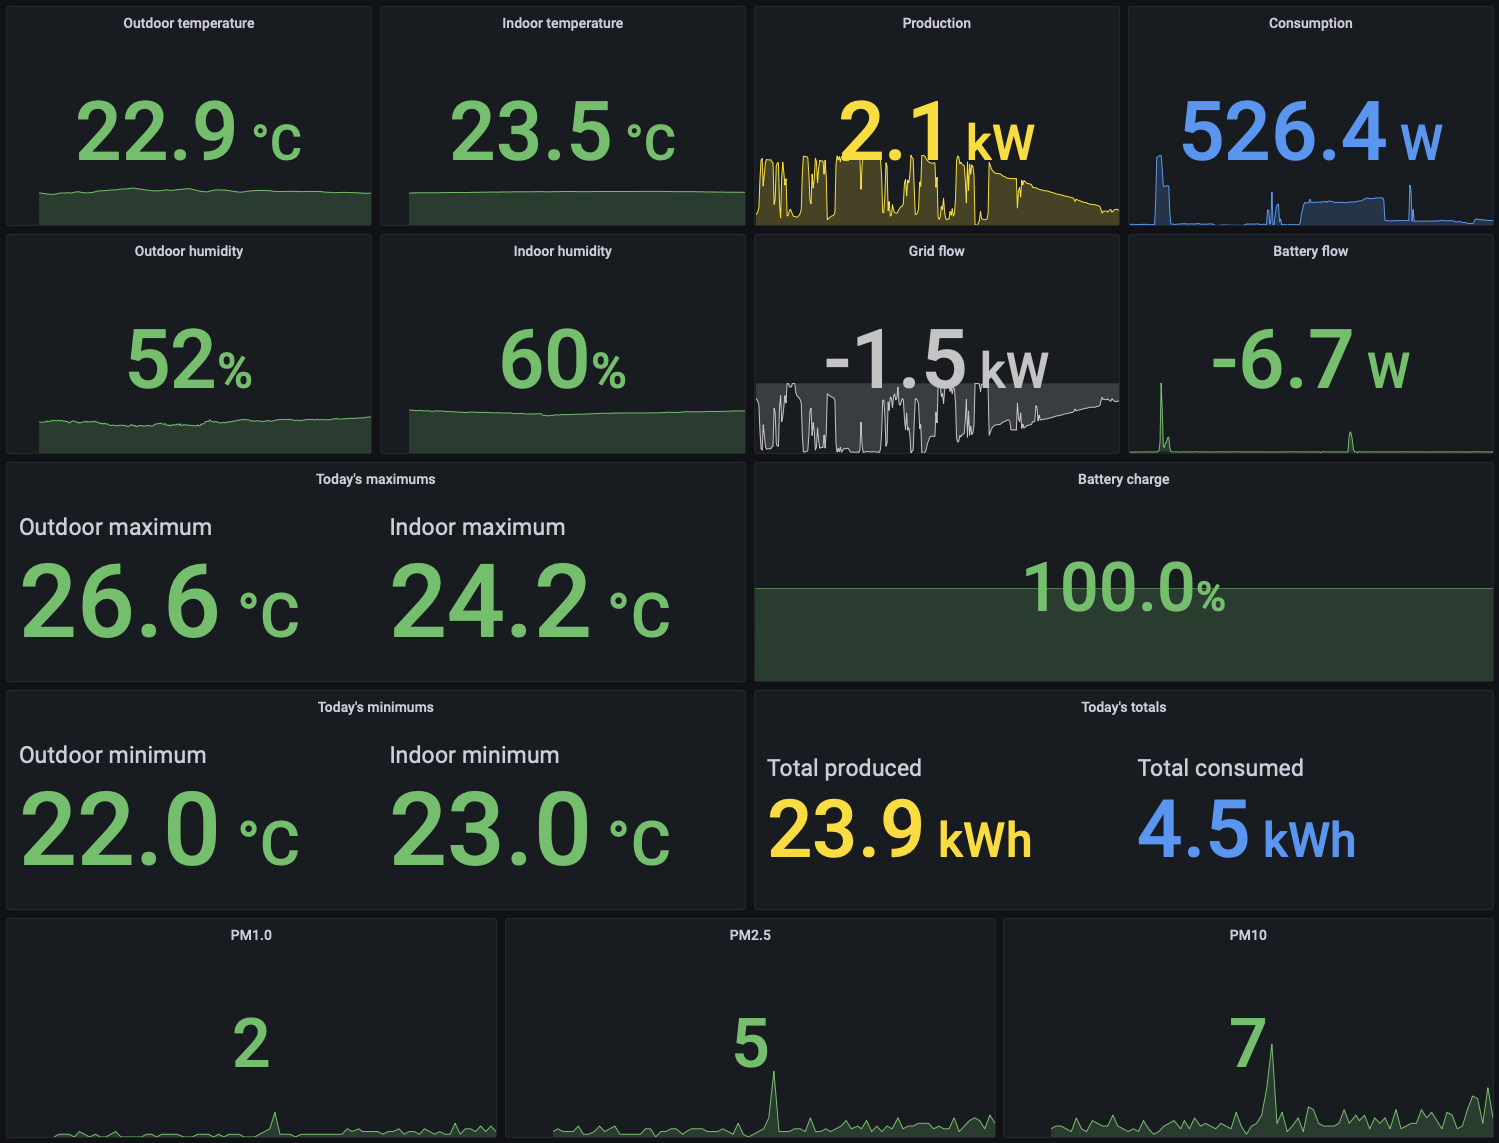
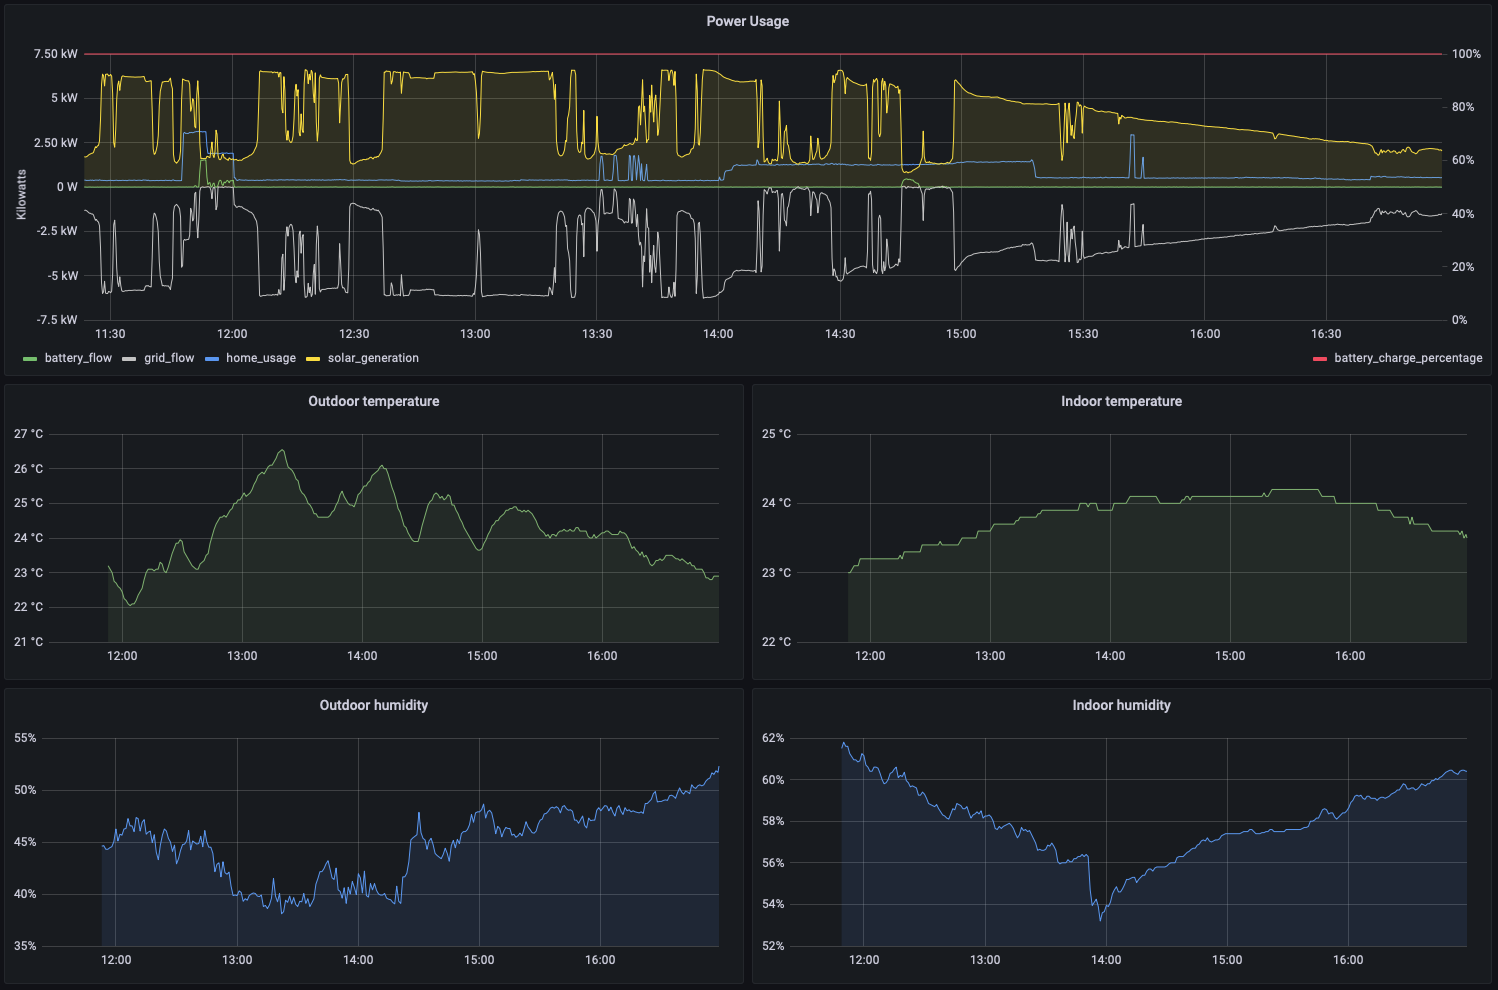
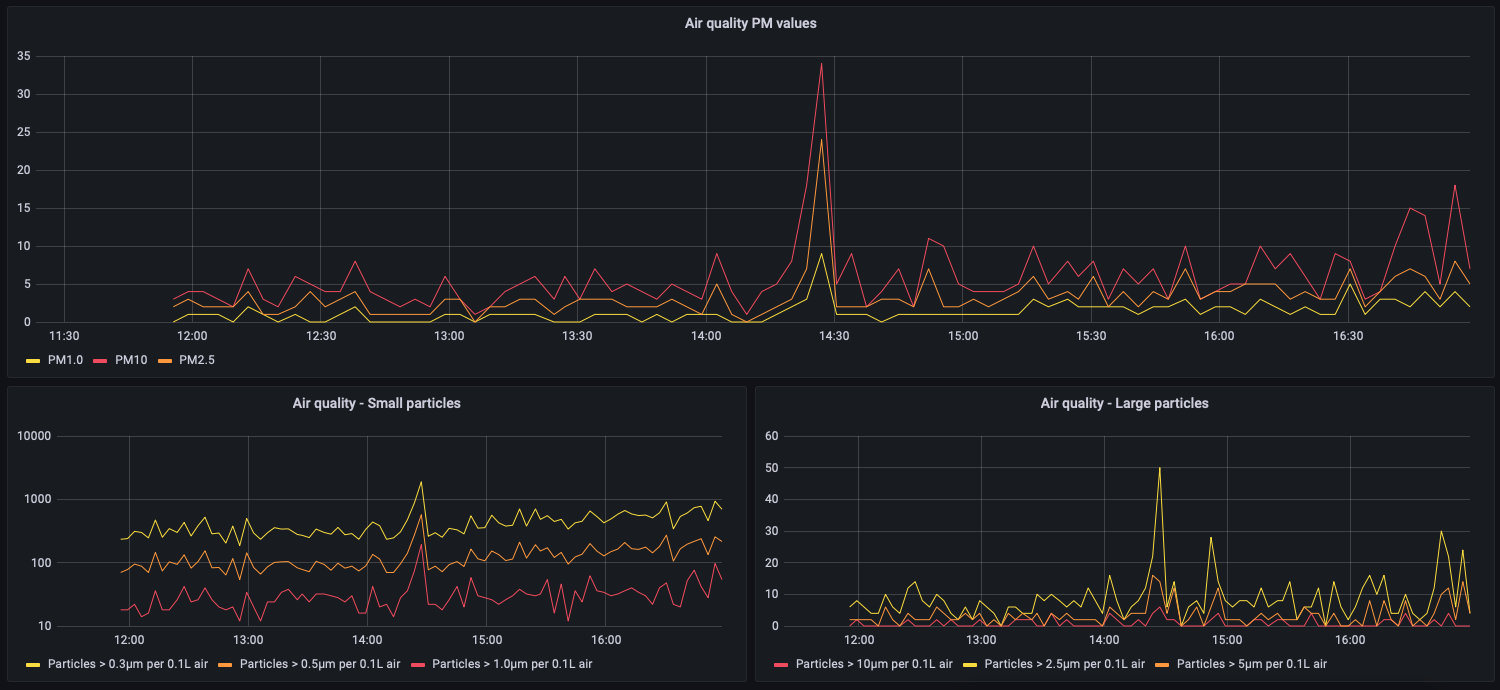
A while back I had set up a Cloudflare Tunnel to my internal Grafana and InfluxDB instances, which meant I had a publicly-accessible domain that I could get to on my work laptop, but actually loading it required a login through Cloudflare (specifically a 2FA code via email). It was straightforward enough to set that up for Navidrome too, but the wrinkle was that the mobile client apps didn’t know anything about Cloudflare and so if that externally-available address was added to them they’d be redirected to Cloudflare instead of getting the expected OpenSubsonic API response back.
Fortunately this sort of problem had been anticipated on both the Cloudflare and Navidrome client end of things! Cloudflare lets you create a service token to be sent in a header with each request, and in both Nautiline and Arpeggi you can add a custom header to be sent on every request when you add a server address.
Getting the service token created on the Cloudflare side was a bit fiddly, their documentation is here and you need to follow the “Authenticate with a single header” to make a couple of manual curl calls against their API to update the application configuration to allow the single-header configuration.
That’s only a one-time setup though, and once that was done I was able to add the externally-accessible domain to the Navidrome client apps and configure it to include that authentication header, and now I’m able to be completely disconnected from our local network and still access Navidrome!
Custom backgrounds for the login screen
One fun thing that Navidrome allows is custom backgrounds on the login page. By default it uses various music-related images from this Unsplash collection, but you can specify a configuration option UILoginBackgroundUrl to choose your own image. There isn’t a built-in way to do the same “Select a random image from a selection of them” that Navidrome does by default, so I wrote a PHP script that I dropped onto my VPS alongside a group of images to choose from that loads the filenames of those images, then redirects to a random one:
<?php

    $files = glob('*.jpg');
    $file = array_rand($files);

    header('Location: ' . "https://virtualwolf.org/files/navidrome/$files[$file]")
?>
By setting the UILoginBackgroundUrl option to this script, I get a different random image of my own from the ones I uploaded!
Dealing with log files
Navidrome logs a fair bit of stuff as it’s working, and under Linux you’d typically use logrotate to automatically compress log files and eventually delete the oldest ones so you don’t end up with all of your disk space being eaten up by logs. BSD and thus macOS has its own log rotation tool called newsyslog but unfortunately the version that’s installed with macOS doesn’t support the R configuration flag to specify a path to a shell command to run instead of using a file that contains the process ID of the process to reload, and as a result Navidrome never gets reloaded and will just keep writing to the rotated file and not the new one.
Rather than screwing around installing logrotate, I decided to take the lazy way out and added a cronjob to just empty out the Navidrome log once a week, at midnight on Monday:
0 0 * * MON cat /dev/null > /Users/virtualwolf/Library/Application\ Support/navidrome/navidrome.log
Phew!
When I started this post I wasn’t expecting to write over three and a half thousand words on it, and yet here we are! I’m very excited to see how this all goes over the next while, and I’m already really enjoying that Navidrome (and as a result both Nautiline and Apeggi too) are a lot more focused on individual albums and displaying their wonderful artwork, it’s nice to just browse through and see what strikes my fancy.