More fun with temperature sensors: ESP32 microcontrollers and MicroPython

More fun with temperature sensors: ESP32 microcontrollers and MicroPython

I’ve blagged previously about our temperature/humidity sensor setup and how they’re attached to my Raspberry Pis, and they’ve been absolutely rock-solid in the three-and-a-half years since then. A few months ago, a colleague at work had mentioned doing some stuff with an ESP32 microcontroller and just recently I decided to actually look up what that was and what one can do with it, because it sounded like it might be a fun new project to play with!

From Wikipedia: ESP32 is a series of low-cost, low-power system on a chip microcontrollers with integrated Wi-Fi and dual-mode Bluetooth.

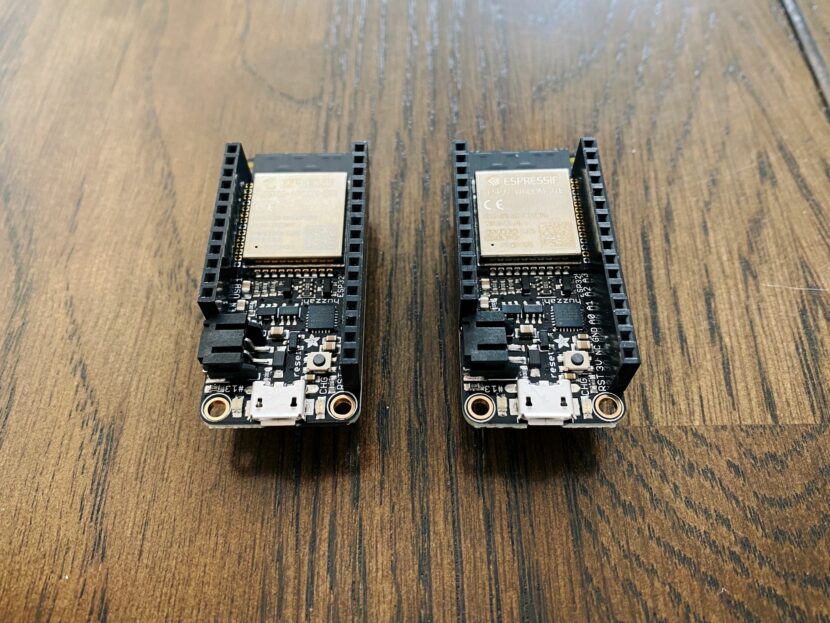
So it’s essentially a tiny single-purpose computer that you write code for and then flash that code onto the board, rather than like with the Raspberry Pi where it has an entire Linux OS running on it. It runs at a blazing fast 240MHz and has 320KB of RAM. The biggest draw for me was that it has built-in wifi so I could do networked stuff easily. There’s a ton of different boards and options and it was all a bit overwhelming, but I ended getting two of Adafruit’s HUZZAH32s which come with the headers for attaching the temperature sensors we have already soldered on. Additionally, they have 520KB of RAM and 4MB of storage.

Next up, I needed to find out how to actually program the thing. Ordinarily you’d write in C like with an Arduino and I wasn’t too keen on that, but it turns out there’s a distribution of Python called MicroPython that’s written explicitly for embedded microcontrollers like the ESP32. I’ve never really done much with Python before, because the utter tyre fire that is the dependency/environment management always put me off (this xkcd comic is extremely relevant). However, with MicroPython on the ESP32 I wouldn’t be having to deal with any of that, I’d just write the Python and upload it to the board! Additionally, it turns out MicroPython has built-in support for the DHT22 temperature/humidity sensor that I’ve already been using with the Raspberry Pis. Score!

There was a lot of searching over many different websites trying to find how to get all this going, so I’m including it all here in the hopes that maybe it’ll help somebody else in future.

Installing MicroPython

At least on macOS, first you need to install the USB to UART driver or your ESP32 won’t even be recognised. Grab it from Silicon Labs’ website and get it installed.

Once that’s done, follow the Getting Started page on the MicroPython website to flash the ESP32 with MicroPython, substituting /dev/ttyUSB0 in the commands for /dev/tty.SLAB_USBtoUART.

Using MicroPython

With MicroPython, there’s two files that are always executed when the board starts up, boot.py which is run once at boot time and is generally where you’d put your connect-to-the-wifi-network code, and main.py which is run after boot.py and will generally be the entry point to your code. To get these files onto the board, you can use a command-line tool called ampy, but it’s a bit clunky and also not supported anymore.

However, there is a better way!

Setting up the development environment

There are two additional tools that make writing your Python code in Visual Studio Code and uploading to the ESP32 an absolute breeze.

The first one is micropy-cli, which is a command-line tool to generate the skeleton of a VSCode project and set it up for full autocompletion and Intellisense of your MicroPython code. Make sure you add the ESP32 stubs first before creating a new micropy project.

The second is a VSCode extension called Pymakr. It gives you a terminal to connect directly to the board and run commands and read output, and also gives you a one-click button to upload your fresh code, and it’s smart enough not to re-upload files that haven’t changed.

There were a couple of issues I ran into when trying to get Pymakr to recognise the ESP32 though. To fix them, bring up the VSCode command palette with Cmd-Shift-P and find “Pymakr > Global Settings”. Update the address field from the default IP address to /dev/tty.SLAB_USBtoUART, and edit the autoconnect_comport_manufacturers array to add Silicon Labs.

Replacing the Raspberry Pis with ESP32s

After I had all of that set up and working, it was time to start coding! As I mentioned earlier I’ve not really done any Python before, so it was quite the learning experience. It was a good few weeks of coding and learning and iterating, but in the end I fully-replicated my Pi Sensor Reader setup with the ESP32s, and with some additional bits besides.

One of the things my existing Pi Sensor Reader setup did was to have a local webserver running so I could periodically hit the Pi and display the data elsewhere. Under Node.js this is extremely easily accomplished with Express, but using MicroPython the options were more limited. There are a number of little web frameworks that people have written for it, but they all seemed quite overkill.

I decided to just use raw sockets to write my own, though one thing I didn’t appreciate until this point was how Node.js’s everything-is-asynchronous-and-non-blocking makes doing this kind of thing very easy, you don’t have to worry about a long-running function causing everything else to grind to a halt while it waits for that function to finish. Python has a thing called asyncio but I was struggling to get my head around how to use it for the webserver part of things until I stumbled across this extremely helpful repository where someone had shown an example of how to do exactly that! (I even ended up making a pull request to fix an issue I discovered with it, which I’m pretty stoked with).

One of the things I most wanted to do was to have some sort of log file accessible in case of errors. With the Raspberry Pi I can just SSH in and check the Docker logs, but once the ESP32s were plugged into power and running, you can’t easily do a similar thing. I ended up writing the webserver with several endpoints to read the log, clear it, reset the board, and view and clear the queue of failed updates.

The whole thing has been uploaded to Codeberg with a proper README of how it works, and they’ve been running connected to the actual indoor and outdoor temperature sensors and posting data to my website for just under a week now, and it’s been absolutely flawless!

(Update October 2021: The dodgy HTTP setup described in this post has been replaced by a much more elegant MQTT one, and all my development efforts have been put towards the MQTT version of my sensor reader code.)

More Raspberry Pi-powered monitoring: air quality!

Here in New South Wales, last year’s bushfires over late spring and into summer were astoundingly bad, and there were days where Sydney had the poorest air quality on the entire planet. Everyone was watching the PM2.5 values, and there were days where Kristina couldn’t go outside because of her asthma. I figured it’d be neat to set up a Raspberry Pi-powered air quality sensor and had ordered the sensor back in February but didn’t get around to putting it into service until now.

This is the bit that lives inside so we can easily see the latest reading:

A small 4" LCD display showing the air quality values for PM1.0, PM2.5, and PM10.

It uses the same sort of setup as my Pimoroni display, and I updated my pi-home-dashboard to add a second page to display the values from the air quality reader.

The sensor itself is a Plantower PMS5003 sensor and is attached to the same Raspberry Pi that the outdoor temperature sensor is on. Adafruit’s instructions on getting it set up were pretty straightforward, and they also give some sample code for how to read it, but it’s in Python which I intensely dislike (I don’t really even have any strong feelings about the language itself one way or the other, but I’ve never had a good experience with the damn package management around it, so I do my damnedest to avoid it). I was able to write the same logic in TypeScript instead — though had to consult the clever people on Ars Technica because parsing the output from the sensor involves things like bit-shifting which is quite low-level and something I’m utterly unfamiliar with — and chucked the whole thing up on Codeberg. It takes ten readings and averages them, and has an HTTP endpoint for pulling the latest values.

I’ve set the front-end up so the colour of the numbers will change to orange and red depending on how bad the air quality is, but hopefully it’s a long while before we actually see that in action!

Powering our house with a Tesla Powerwall 2 battery

I posted back in March about our our shiny new solar panels and efforts to reduce our power usage, and as of two weeks ago our net electricity grid power usage is now next to zero thanks to a fancy new Tesla Powerwall 2 battery!

A photo of a white Tesla Powerwall 2 battery and Backup Gateway mounted against a red brick wall inside our garage.
A side-on view of a white Tesla Powerwall 2 battery mounted against a red brick wall.

We originally weren’t planning on getting a battery back when we got our solar panels — and to to be honest they still don’t make financial sense in terms of a return on investment — but we had nine months of power usage data and I could see that for the most part the amount of energy the Powerwall can store would be enough for us to avoid having to draw nearly anything whatsoever from the grid*.

* Technically this isn’t strictly true, keep reading to see why.

My thinking was, we’re producing stonking amounts of solar power and are feeding it back to the grid at 7c/kWh, but have to buy power from the grid after the sun goes down at 21c/kWh. Why not store as much as possible of that for use during the night?

The installation was done by the same people who did the solar panels, Penrith Solar Centre, and as before, I cannot recommend them highly enough. Everything was done amazingly neatly and tidily, it all works a treat, and they fully cleaned up after themselves when they were done.

We have 3-phase power and the solar panels are connected to all three phases (⅓ of the panels are connected individually to each phase) and the Powerwall has only a single-phase inverter so is only connected to one phase, but the way it handles everything is quite clever: even though it can only discharge on one phase, it has current transformers attached to the other two phases so it can see how much is flowing through there, and it’ll discharge on its phase an amount equal to the power being drawn on the other two phases (up to its maximum output of 5kW anyway) to balance out what’s being used. The end result is that the electricity company sees us feeding in the same amount as we’re drawing, and thanks to the magic of net-metering it all balances out to next to zero! This page on Solar Quotes is a good explanation of how it works.

The other interesting side-effect is that when the sun is shining and the battery is charging, it’s actually pulling power from the grid to charge itself, but only as much as we’re producing from the solar panels. Because the Enphase monitoring system doesn’t know about the battery, it gives us some amusing-looking graphs whereby the morning shows exactly the same amount of consumption as production up until the battery is fully-charged!

We also have the Powerwall’s “Backup Gateway”, which is the smaller white box in the photos at the top of this post. In the event of a blackout, it’ll instantaneously switch over to powering us from the battery, so it’s essentially a UPS for the house! Again, 3-phase complicates this slightly and the Powerwall’s single-phase inverter means that we can only have a single phase backed up, but the lights and all the powerpoints in the house (which includes the fridge) are connected to the backed-up phase. The only things that aren’t backed up are the hot water system, air conditioning, oven, and stove, all of which draw stupendous amounts of power and will quickly drain a battery anyway.

We also can’t charge the battery off the solar panels during a blackout… it is possible to set it up like that, but there needs to be a backup power line going back from a third of the solar panels back to the battery, which we didn’t get installed when we had the panels put in in February. There was a “Are you planning on getting a battery in the next six months” question which we said no to. 😛 If we’d said yes, they would have installed the backup line at the time; it’s still possible to install it now, but at the cost of several thousand dollars because they need to come out and pull the panels up and physically add the wiring. Blackouts are not remotely a concern here anyway, so that’s fine.

In the post back in March, I included three screenshots of the heatmap of our power usage, and the post-solar-installation one had the middle of the day completely black. Spot in the graph where we had the battery installed!

We ran out of battery power on the 6th of November because the previous day had been extremely dark and cloudy and we weren’t able to fully charge the battery from the solar panels that day (it was cloudy enough that almost every scrap of solar power we generated went to just powering the house, with next to nothing left over to put into the battery), and the 16th and 17th were both days where it was hot enough that we had the aircon running the whole evening after the sun went down and all night as well.

Powershop’s average daily use graph is pretty funny now as well.

And even more so when you look all the way back to when we first had the smart meter installed, pre-solar!

For monitoring the Powerwall itself, you use Tesla’s very slick app where you can see the power flow in real time. When the battery is actively charging or discharging, there’s an additional line going to or from the Powerwall icon to wherever it’s charging or discharging to or from.

You can’t tell from a screenshot of course, but those on the lines connecting the Solar to the Home and Grid icons animate in the direction that the power is flowing.

It also includes some historical graph data as well, but unfortunately it’s not quite as nice as Enphase’s, and doesn’t even have a website, you can only view it in the app. There’s a website called PVOutput that you can send your solar data to, and we have been doing that via Enphase since we got the solar panels installed, but the Powerwall also has its own local API you can hit to scrape the power usage and flows, and battery charge percentage. I originally found this Python script to do exactly that, but a) I always struggle to get anything related to Python working, and b) the SQLite database that it saves its data into kept intermittently getting corrupted, and the only way I’d know about it is by checking PVOutput and seeing that we hadn’t had any updates for hours.

So, I wrote my own in TypeScript! It saves the data into PostgreSQL, so far it’s been working a treat and it’s all self-contained in a Docker container. The graphs live here, and to see the power consumption and grid and battery flow details, click on the right-most little square underneath the “Prev Day” and “Next Day” links under the graph. Eventually I’m going to send all this data to my website so I can store it all there, but for the moment PVOutput is working well.

It also won’t shock anybody to know that I updated my little Raspberry Pi temperature/power display to also include the battery charge and whether it’s charging or discharging (charging has a green upwards arrow next to it, discharging has a red downwards arrow).

My only complaint with the local API is that it’ll randomly become unavailable for periods of time, sometimes up to an hour. I have no idea why, but when this happens the data in the Tesla iPhone app itself is still being updated properly. It’s not a big deal, and doesn’t actually affect anything with regards to battery’s functionality.

Overall, we’re exceedingly happy with our purchase, and it’s definitely looking like batteries in general are going to be a significant part of the electrical grid as we move to higher and higher percentages of renewables!

Visualising Git repository histories with Gource and ffmpeg

First, a disclaimer: this is entirely based on a blog post from a co-worker on our internal Confluence instance and I didn’t come up with any of it. 😛

Gource is an extremely cool tool for visualising the history of a Git repository (and other source control tools) via commits, and it builds up an animated tree view. When combined with ffmpeg you can generate a video of that history!

On a Mac, install Gource and ffmpeg with Homebrew:

$ brew install gource ffmpeg

Then cd into the repository you’re visualising, and let ‘er rip!

$ gource -1280x720 \
    --stop-at-end \
    --seconds-per-day 0.2 \
    -a 1 \
    -o - \
    | ffmpeg -y \
    -r 60 \
    -f image2pipe \
    -vcodec ppm \
    -i - \
    -vcodec libx264 \
    -preset fast \
    -crf 18 \
    -threads 0 \
    -bf 0 \
    -pix_fmt yuv420p \
    -movflags \
    +faststart \
    output.mp4

Phew! The main options to fiddle with are the resolution from gource (1280x720 in this case), and the crf setting from ffmpeg (increase the number to decrease the quality and make a smaller file, or lower the number to increase the quality and make a larger file).

I ran it over my original website repository that started its life out as PHP in 2011 and was moved to Perl:

And then my Javascript website that I started in 2016 and subsequently moved to TypeScript:

How cool is that?!

I also ran it over the codebase of the main codebase at work that powers our internal PaaS that I support and it’s even cooler because the history goes back to 2014 and there’s a ton of people working on it at any given time.

More space: the Pimoroni HyperPixel4 display on a Raspberry Pi Zero W

Back at the start of 2018 I blogged about my Raspberry Pi temperature display setup and it’s been pretty excellent and utterly reliable since then, but because of its small size — the display is only 2 inches — it wasn’t particularly visible from across the room. That, combined with the discovery that the Envoy power consumption monitoring system we had installed with the solar panels has a locally-accessible API that you can use to get real-time production and consumption data (which lives at http://<ip-of-the-envoy-box>/production.json?details=1), made me start looking into larger displays so I could include both temperature/humidity data and our power consumption.

My first port of call was the 2.7-inch version of the original 2-inch display. I ordered it on the 6th of April then… nothing showed up. I’d assumed the PaPiRus was MIA and had instead ordered a 4-inch, 800×480-pixel display in the form of Pimoroni’s HyperPixel4 display, the non-touch version. The Raspberry Pi registers it as a regular display so you run a full desktop environment windowing system on it rather than the way the PaPiRus works.

Of course, about a week after ordering the HyperPixel 4, the PaPiRus finally arrived! The 2.7-inch version of the PaPiRus is 264 pixels wide by 176 pixels high, so not exactly high-resolution. There’s actually quite a lot of freedom to tweak the position of the elements on screen pixel-by-pixel, but I quickly discovered that that’s extremely tedious when doing it directly on the Raspberry Pi itself because it takes several seconds for it to contact the required endpoints to pull in the data and then refresh the whole display. As well as writing text, the display can also display (1-bit) bitmap images, so I decided to change tack and instead of using the PaPiRus’s text API I wrote a probably-slightly-overengineered Node.js application that would run on the Raspberry Pi 4B, fetch the data from the outdoor and indoor sensors as well as the Envoy, use the Javascript Canvas API to lay everything out, and then convert it to a bitmap image that the Python script on the Pi Zero W would fetch every minute and then update the display with.

The biggest advantage of this system is that I could run it locally on my regular computer to quickly tweak the positioning without having to wait for the PaPiRus display to refresh each time, and I set it up so I could invert the colours to be white on black instead so I could clearly see the boundaries of the canvas. I put the code up if anyone is interested in poking through it, and the end result looks like this:

Having over-engineered my Node.js solution, the HyperPixel4 display arrived maybe a couple of weeks later! It’s extremely slick-looking, but unfortunately the little plastic nubs that are meant to keep the screen in place in the house aren’t actually big enough to hold it in, and I managed to have the display itself pop out and crack some of the wires that feed the display and it caused all sorts of display weirdness. I emailed the place that makes the HyperPixel display about it and they were super nice and helpful and sent me out a replacement display with no questions asked! While I was waiting for the new one to arrive, the old broken one was partially working enough that I could at least get everything up and running how I wanted it, anyway.

Because using the HyperPixel is the same as if you’d hooked up an HDMI display and were using the Pi as a regular computer, I started from the full-blown Raspbian desktop image, not the Lite one. It was relatively straightforward to get everything going (mostly just installing and configuring the driver from Pimoroni’s GitHub repository), but there were some additional things I needed to do to get everything working as I wanted. I settled on a Node.js backend and React frontend setup (the separate backend was necessary because CORS; I couldn’t hit the Envoy URL directly from the browser on the Pi, so I have to have the Node.js backend pull in the data and then feed it to the React app), both of which are running in a Docker image on the Raspberry Pi 4B.

  • By default the HyperPixel4 runs at full brightness, so I followed this to turn it way down, and also to set up a cron job to entirely turn the display off at midnight and turn it back on at 8am.
  • To get the Pi to open Chromium full-screen on boot, I followed these instructions.
  • To disable the annoying “Restore pages” dialog in Chromium, this on the Raspberry Pi Stack Exchange was helpful.
  • Raspbian comes by default with a VNC server installed, just not enabled. To enable it and allow access directly from macOS’s “Connect to Server” dialog in the Finder:
    • Run sudo raspi-config, go to Interface Options > VNC and enable it.
    • Run vncpasswd -service to set a VNC password (note if it’s longer than eight characters, only the first eight are used when connecting).
    • Create the file /etc/vnc/config.d/common.custom with the contents: Authentication=VncAuth
    • Then Restart the VNC service with sudo systemctl restart vncserver-x11-serviced
  • And lastly, to disable the Pi from turning the screen off after activity, I followed these steps.

My ~/.config/lxsession/LXDE-pi/autostart ultimately ended up looking like this:

@lxpanel --profile LXDE-pi
@pcmanfm --desktop --profile LXDE-pi
point-rpi
@chromium-browser --start-fullscreen --start-maximized --app=http://fourbee:3003
@xset s off
@xset -dpms 
@xset s noblank
@sudo /home/pi/Source/rpi-hardware-pwm/pwm 19 1000000 135000

And the whole setup looks like this:

A photo of a small LCD display showing outdoor and indoor temperature and current power consumption and production. The text is white on black.

It’s quite the improvement in visibility and I can easily read it from all the way in the kitchen! It updates itself automatically every 30 seconds, and there’s no e-ink full-display-refresh screen-blanking when it does.

Memories redux: Flickr

I posted back in December that I’d created my own version of Facebook’s “Memories” feature for my formerly-Tumblr-and-now-Mastodon media posts, and even at the time I’d had the thought of doing it for Flickr as well, since that’s where all my Serious Photography goes.

Well, now I have!

It wasn’t quite as straightforward as my Media memories functionality, because there I could just do a single database call, but for Flickr I’m having to make multiple API calls each time. Fortunately two of the search parameters that flickr.photos.search offers are min_taken_date and max_taken_date, so my approach is to run a query for whatever the current day of the year it happens to be for each year going back to 2007—this being when my account was created and when I first started posting photos to Flickr—with the min_taken_date set to 00:00 on that particular day, and max_taken_date set to 23:59 on that same day. It does mean that currently there’s 13 API calls each time the Memories page is loaded and this will increase by one with each year that goes past, but Flickr’s API docs say “If your application stays under 3600 queries per hour across the whole key (which means the aggregate of all the users of your integration), you’ll be fine”. That’s one query every single second for an entire hour, which absolutely isn’t going to be happening, so I ought to remain well under the limit.

I’m excited to see what forgotten gems from the past show up, and also being reminded of how terrible I was when I was first starting out taking photos. 😛

HomePod, Docker on Raspberry Pi, and writing Homebridge plugins

Apple announced the HomePod “smart speaker” in 2017, and started shipping them in early 2018. I had zero interest the smart speaker side of things — I’d never have Google or Amazon’s voice assistants listening to everything I say, and despite trusting Apple a lot more with privacy compared to those two companies, the same goes for Siri — but the praise for the sound quality definitely piqued my interest, especially having set up shairplay-sync on the Raspberry Pi as an AirPlay target and enjoying the ease of streaming music to a good set of speakers. For AU$499 though, I wasn’t going to bother as the setup for the stereo system in our home office did a reasonable enough job. It consisted of an amplifier that was sitting next to my desk, going into an audio switchbox that sat next to my computer and could be switched between the headphone cable attached to my computer, and one that snaked across the floor to the other side to Kristina’s desk so she could plug into it, with the speakers were sitting on the bookshelves on opposite sides of the room (you can see how it looked in this post, the speakers are the black boxes visible on the bottom shelves closest to our desks).

Fast-forward to last week, and someone mentioned that JB Hi-Fi were having a big sale on the HomePod and it was only AU$299! The space behind my desk was already a rat’s nest of cables, and with the standing desk I’ve ordered from IKEA I was wanting to reduce the number of cables in use, and being able to get rid of a bunch of them and replace it with a HomePod, I decided to get in on it (it’s possible to turn the “Listen for ‘Hey Siri'” functionality off entirely).

It arrived on Tuesday, and to say I’m impressed with the sound quality is a bit of an understatement, especially given how diminutive it is. It has no trouble filling the whole room with sound, the highs are crystal clear, and if the song is bassy enough you can feel it through the floor! It shows up just as another AirPlay target so it’s super-easy to play music to it from my phone or computer. I took a photo of our new setup and you can see the HomePod sitting on the half-height bookshelf right at the bottom-left of the frame (the severe distortion is because I took the photo on our 5D4 with the 8-15mm Fisheye I borrowed from a friend, which requires turning lens corrections on to avoid having bizarrely-curved vertical lines, which in turn distorts the edges of the image quite a bit).

The setup and configuration of the HomePod is done via Apple’s Home app, which uses a framework called HomeKit to do all sorts of home automation stuff, and the HomePod is one of the devices that can work as the primary “hub” for HomeKit. I have no interest in home automation as such, but a selling point of the HomeKit is that’s a lot more secure than random other automation platforms, and one of the things it supports is temperature sensors. Someone wrote a Node.js application called Homebridge that lets you run third-party plugins and even write your own ones to appear and interact with in HomeKit, so I decided I’d see if I could hook up the temperature sensors that are attached to the Raspberry Pi(s)!

I’d ordered a 4GB Raspberry Pi 4B last month because I wanted to have a bit more grunt than the existing Pi 3B — which only has 1GB RAM — and to start using Docker with it, and it arrived on the 1st of this month. With that up and running inside in place of my original Raspberry Pi 3B, I moved the Pi 3B and the outside temperature sensor much further outside and attached it to our back room that’s in the backyard, because the previous position of the sensor underneath the pergola and next to the bricks of the house meant that in summer the outdoor temperatures would register hotter than the actual air temperature, and because the bricks absorb heat throughout the day, the temperatures remain higher for longer too.

Installing and configuring Homebridge

Next step was to set up Homebridge, which I did by way of the oznu/docker-homebridge image, which in turn meant getting Docker — and learning about Docker Compose and how handy it is, and thus installing it too! — installed first:

  1. Install Docker — curl -sSL https://get.docker.com | sh
  2. Install Docker Compose — sudo apt-get install docker-compose
  3. Grab the latest docker-homebridge image for Raspberry Pi — sudo docker pull oznu/homebridge:raspberry-pi
  4. Create a location for your Homebridge configuration to be stored — mkdir -p ~/homebridge/config

Lastly, write yourself a docker-compose.yml file inside ~/homebridge

version: '2'
services:
  homebridge:
    image: oznu/homebridge:raspberry-pi
    restart: always
    network_mode: host
    volumes:
      - ./config:/homebridge
    environment:
      - PGID=1000
      - PUID=1000
      - HOMEBRIDGE_CONFIG_UI=1
      - HOMEBRIDGE_CONFIG_UI_PORT=8080

Then bring the Homebridge container up by running sudo docker-compose up --detach from ~/homebridge. The UI is accessible at http://<address-of-your-pi>:8080 and logs can be viewed with sudo docker-compose logs -f.

The last step in getting Homebridge recognised from within the Home app is iOS is to open the Home app, tap the plus icon in the top-right and choose “Add accessory”, then scan the QR code that the Homebridge UI displays.

Writing your own Homebridge plugins

Having Homebridge recognised within the Home app isn’t very useful without plugins, and there was a lot of trial and error involved here because I was writing my own custom plugin rather than just installing one that’s been published to NPM, and I didn’t find any single “This is a tutorial on how to write your own plugin” pages.

Everything is configured inside ~/homebridge/config, which I’ll refer to as $CONFIG from now on.

Firstly, register your custom plugin so Homebridge knows about it by editing $CONFIG/package.json and editing the dependencies section to add your plugin. It has to be named homebridge-<something> to be picked up at all, I called mine homebridge-wolfhaus-temperature and so my $CONFIG/package.json looks like this:

{
  "private": true,
  "description": "This file keeps track of which plugins should be installed.",
  "dependencies": {
    "homebridge-dummy": "^0.4.0",
    "homebridge-wolfhaus-temperature": "*"
  }
}

The actual code for the plugin needs to go into $CONFIG/node_modules/homebridge-<your-plugin-name>/, which itself is a Node.js package, which also needs its own package.json file located at $CONFIG/node_modules/homebridge-<your-plugin-name>/package.json. You can generate a skeleton one with npm init — assuming you have Node.js installed, if not, grab nvm and install it — but the key parts needed for a plugin to be recognised by Homebridge is adding the keywords and engine sections into your package.json:

{
  "name": "homebridge-wolfhaus-temperature",
  "version": "0.0.1",
  "main": "index.js",
  "keywords": [
    "homebridge-plugin"
  ],
  "engines": {
    "homebridge": ">=0.4.53"
  }
}

index.js is your actual plugin code that will be run when Homebridge calls it.

Once I got this out of the way, the last bit was a LOT of trial and error to actually get the plugin working with Homebridge and the Home app on my iPhone. The main sources of reference were these:

After several hours work, I had not the nicest code but working code (Update 2020-04-12 — moved to ES6 classes and it’s much cleaner), and I’ve uploaded it.

The final bit of the puzzle is telling Homebridge about the accessories, which are the things that actually show inside the Home app on iOS. For this, you need to edit $CONFIG/config.json and edit the accessories section to include your new accessories, which will use the plugin that was just written:

{
    "bridge": {
        "name": "Traverse",
        [...]
    },
    "accessories": [
        {
            "accessory": "WolfhausTemperature",
            "name": "Outdoor Temperature",
            "url": "http://pi:3000/rest/outdoor"
        },
        {
            "accessory": "WolfhausTemperature",
            "name": "Indoor Temperature",
            "url": "http://fourbee:3000/rest/indoor"
        }
    ],
    "platforms": []
}

The url is the REST endpoint that my pi-sensor-reader runs for the indoor and outdoor sensors, and the name needs to be unique per accessory.

Homebridge needs restarting after all these changes, but once you’re done, you’ll have two new accessories showing in Home!

They initially appear in the “Default Room”, you can add an “Indoor” and “Outdoor” room to put them into by tapping on the Rooms icon in the bottom bar, then tapping the hamburger menu at the top-left, choosing Room Settings > Add Room, then long-pressing on the temperature accessory itself and tapping the settings cog at the bottom-right and selecting a different room for it to go into.

What’s next?

As part of doing all this, I moved all of my public Git repositories over to GitHub (Update May 2025: Make that Codeberg) where they’re more likely to be actually seen by anybody and will hopefully help someone! I also updated my pi-sensor-reader to use docker-compose, and fully-updated the README to document all the various options.

Next on the Homebridge front is going to be tidying up the plugin code — including moving to async/await — and adding the humidity data to it!

Installing OpenWRT on a Netgear D7800 (Nighthawk X4S) router

I had blogged back in October of last year about setting up DNS over HTTPS, and it’s been very reliable, except for the parts where I’ve had to run Software Update on the Mac mini to pick up security update, and while it’s restarting all of our DNS resolution stops working! I’d come across OpenWRT a while back, which is an open-source and very extensible firmware for a whole variety of different routers, but I did a bunch of searching and hadn’t come across any reports of people fully-successfully using it on our specific router, the Netgear D7800 (also known as the Nighthawk X4S), just people having various problems. One of the reasons I was interested in OpenWRT because it’s Linux-based and extensible and I would be able to move the DHCP and DNS functionality off the Mac mini back onto the router where it belongs, and in theory bring the encrypted-DNS over as well.

I finally bit the bullet and decided to give installing it a go today, and it was surprisingly easy. I figured I’d document it here for posterity and in the hopes that it’ll help someone else out in the same position as I was.

Important note: The DSL/VDSL modem in the X4S is not supported under OpenWRT!

Installation

  1. Download the firmware file from the “Firmware OpenWrt Install URL” (not the Upgrade URL) on the D7800’s entry on OpenWRT.org.
  2. Make sure you have a TFTP client, macOS comes with the built-in tftp command line tool. This is used to transfer the firmware image to the router.
  3. Unplug everything from the router except power and the ethernet cable for the machine you’ll be using to install OpenWRT from (this can’t be done wirelessly).
  4. Set your machine to have a static IP address in the range of 192.168.1.something. The router will be .1.
  5. Reset the router back to factory settings by holding the reset button on the back of it in until the light starts flashing.
  6. Once it’s fully started up, turn it off entirely, hold the reset button in again and while still holding the button in, turn the router back on.
  7. Keep the reset button held in until the power light starts flashing white.

Now the OpenWRT firmware file needs to be transferred to the router via TFTP. Run tftp -e 192.168.1.1 (-e turns on binary mode), then put <path to the firmware file>. It’ll transfer the file and then install it and reboot, this will take several minutes.

Once it’s up and running, the OpenWRT interface will be accessible at http://192.168.1.1, with a username of root and no password. Set a password then follow the quick-start guide to turn on and secure the wifi radios — they’re off by default.

Additional dnsmasq configuration and DNS-over-TLS

I mentioned in my DNS-over-HTTPS post that I’d also set up dnsmasq to do local machine name resolution, this is very trivially set up in OpenWRT under Network > DHCP and DNS and putting in the MAC address and desired IP and machine name under the Static Leases section, then hitting Save & Apply.

The other part I wanted to replicate was having my DNS queries encrypted. In OpenWRT this isn’t easily possible with DNS-over-HTTPS, but is when using DNS-over-TLS, which gets you to the same end-state. It requires installing Stubby, a DNS stub resolver, that will forward DNS queries on to Cloudflare’s DNS.

  1. On the router, go to System > Software, install stubby.
  2. Go to System > Startup, ensure Stubby is listed as Enabled so it starts at boot.
  3. Go to Network > DHCP and DNS, under “DNS Forwardings” enter 127.0.0.1#5453 so dnsmasq will forward DNS queries on to stubby, which in turns reaches out to Cloudflare; Cloudflare’s DNS servers are configured by default. Stubby’s configuration can be viewed at /etc/config/stubby.
  4. Under the “Resolv and Hosts Files” tab, tick the “Ignore resolve file” box.
  5. Click Save & Apply.

Many thanks to Craig Andrews for his blog post on this subject!

Quality of Service (QoS)

The last thing I wanted to set up was QoS, which allows for prioritisation of traffic when your link is saturated. This was pretty straightforward as well, and just involved installing the luci-app-sqm package and following the official OpenWRT page to configure it!

Ongoing findings

I’ll update this section as I come across other little tweaks and changes I’ve needed to make.

Plex local access

We use Plex on the Xbox One as our media player (the Plex Media Software runs on the Mac mini), and I found that after installing OpenWRT on the router, the Plex client on the Xbox couldn’t find the server anymore despite being on the same LAN. I found a fix on Plex’s forums, which is to go to Network > DHCP and DNS, and add the domain plex.direct to the “Domain whitelist” field for the Rebind Protection setting.

Xbox Live and Plex Remote Access (January 2020)

Xbox Live is quite picky about its NAT settings, and requires UPnP to be enabled or you can end up with issues with voice chat or gameplay in multiplayer, and similarly Plex’s Remote Access requires UPnP as well. This isn’t provided by default with OpenWRT but can be installed with the luci-app-upnp and the configuration shows up under Services > UPnP in the top navbar. It doesn’t start by default, so tick the “Start UPnP and NAT-PMP service” and “Enable UPnP” boxes, then click Save & Apply.

Upgrading to a new major release (February 2020)

When I originally wrote this post I was running OpenWRT 18.06, and now that 19.07 has come out I figured I’d upgrade, and it was surprisingly straightforward!

  1. Connect to the router via ethernet, make sure your network interface is set to use DHCP.
  2. Log into the OpenWRT interface and go to System > Backup/Flash Firmware and generate a backup of the configuration files.
  3. Go to the device page on openwrt.org and download the “Firmware OpenWrt Upgrade” image (not the “Firmware OpenWrt Install” one).
  4. Go back to System > Backup/Flash Firmware, choose “Flash image” and select your newly-downloaded image.
  5. In the next screen, make sure “Keep settings and retain the current configuration” is not ticked and continue.
  6. Wait for the router light to stop flashing, then renew your DHCP lease (assuming you’d set it up to be something other than 192.168.1.x like I did).
  7. Log back into the router at http://192.168.1.1 and re-set your root password.
  8. Go back to System > Backup/Flash Firmware and restore the backup of the settings you made (then renew your DHCP lease again if you’d changed the default range).

I had a couple of conflicts with files in /etc/config between my configuration and the new default file, so I SSHed in and manually checked through them to see how they differed and updated them as necessary. After that it was just a case of re-installing the luci-app-sqm, luci-app-upnp, and stubby packages, and I was back in business!

Coding my own personal version of Facebook’s Memories feature

I deleted my Facebook account way back somewhere around 2009, but the one thing that Kristina shows me that I think is a neat idea is the “memories” feature, where it shows posts from previous years on that day in particular. I realised I could very much code something up myself to accomplish the same thing, given I have Media posts going back to 2009.

And so I did! By default it’ll show all posts that were made on this exact same date in each previous year (if any), excluding today’s, and you can also pick an arbitrary date and view all posts on that date for each previous year as well.

I was originally going to have it send me an email each day, but I quickly realised I couldn’t be bothered dealing with HTML emails and so it ended up in its current state. It’s not perfect, I’m still wrestling with timezones — if you view the main Memories page before 11am Sydney time, you’ll get yesterday’s date because 11am Sydney time is currently when the day switches over to the new day when it’s UTC time. If I do specify a Sydney time in my code, the automated tests fail on Bitbucket Cloud because they’re all running in UTC. I’m sure it’s fixable, I just haven’t had the brain capacity to sit down and work it out. 😛 Between this and my tag browser, it’s been pretty fun seeing old posts I’d forgotten about.

Update 21st December: I found these two posts about timezones in Postgres, and between them and firing up two Docker containers in UTC time for testing — one for Postgres and one for my code — I managed to get it fully working! 🎉

Of coding and a history of iPhone photo filter apps

I had last week off work, mostly due to being in desperate need of a holiday, I didn’t go anywhere but just chilled out at home. I did do a bunch of coding on my website though!

I’d been using Tumblr to post my random snaps from 2009 to about 2016 or so and cross-posting them to Twitter, before I found that Tweetbot had custom image posting functionality where you could post images to a URL that replied with a specific format and Tweetbot would use those image URLs in its tweets. I added functionality for that on my website and had been saving tweets and images directly since 2016.

Last year, it occurred to me that I should import my posts from Tumblr to my website in order to have everything in one place. I obsessively tag my Flickr photos and as a result am able to find almost anything I’ve taken a photo of very quickly, and while I hadn’t quite gone to those same levels of tagging with Tumblr, all my posts there had at least some basic tags on them that I wanted to preserve when bringing them in to my website, so I had coded up a tags system for my Media page and a script to scrape the Tumblr API and suck the posts, images, and tags in. I also wrote a very simple little React app to be able to continue adding tags to new posts I’m making directly to my website.

The one thing that was missing was the ability to see all of the current tags, and to search by tag, so this past week I’ve been doing exactly that! I have a page that shows all the tags that exist with links to view just the posts tagged with a given tag, and on the front page the tags that a post has are clickable as well.

I realised I had mucked up the tagging on a few posts so was going through and re-tagging and updating them, and it struck me just how much I used to rely on those camera filter apps to hide how shit photos from old iPhones used to be. One of the ways I’d tagged my photos on Tumblr, and I’ve continued this even now with the new direct-posting-via-a-custom-iOS-shortcut that I’ve got set up on my iPhone, is with the name of app I used to edit the photo. Going roughly chronologically as I started using each app:

Instagram was only a very brief foray, and VSCOCam was by far my most-used app. Unfortunately it went downhill a couple of years ago and they Androidified it and now all of the icons are utterly inscrutable and you also can’t get RAW files taken from within the app back out again in anything but JPEG. Apparently there’s a thing called a VSCO Girl which I suspect is part of what happened there.

My most recent editing app prior to getting the iPhone 11 Pro has been Darkroom, it’s extremely slick and integrates directly with the regular photo library on your phone and offers a similar style of film-esque presets to VSCOCam, though fewer in number.

With the iPhone 11 Pro, however, the image quality is good enough that I don’t even feel the need to add obviously-film-looking presets to the images. I take the photo, hit the “Auto” button in Photos.app to add a bit of contrast, and usually use the “Vivid” preset to bring the colours up a bit, but otherwise they’re pretty natural-looking.

That said, I’ll probably end up heading back to Darkroom at some point as I do like my film aesthetic!