Ever since we moved into our house almost seven years ago now we’d been slowly making the place more energy efficient and reducing our power usage. First were double-glazed windows, then a new roof, then replacing all the light globes with LED ones, and slowly but surely replacing our various appliances with newer ones (the fridge was replaced shortly after we had our kitchen redone and used over a third less power than the old one, we got a dryer as well that uses a heap less power than trying to dry things in the combination washer/dryer, and a new air conditioner just before summer of 2018 to replace the ancient and increasingly-creaky one). Despite power bills going up at a fairly absurd rate over the past decade, we actually didn’t see much of an increase at all thanks to us being able to steadily use less power over time.
There’s an electricity company called Powershop that a few people at work use and are very happy with, and all their power is 100% carbon offset. We switched over to them in mid-September last year, and got our power meter upgraded — for free — to a smart meter in early October. The data from the meter is really fascinating, you can view it right on Powershop’s site and they give you a heat map of half-hour blocks throughout the whole day where you can see specifically when and how much power you’re using. A snapshot from part of October looked like this:
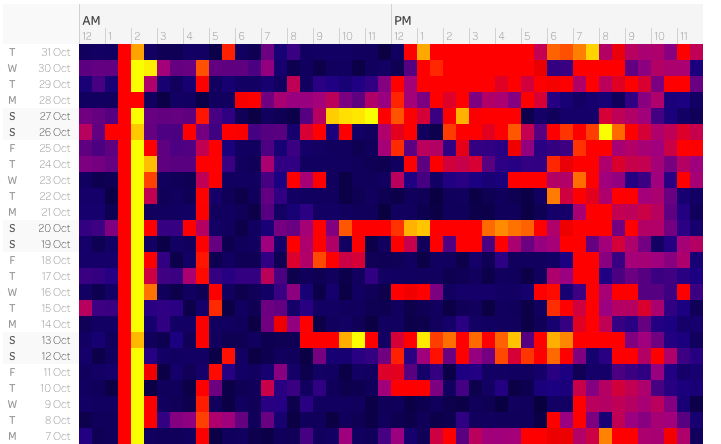
Brighter means more power being used, darker means less. You can clearly see the weekends during the day when we had the air conditioning on, and that much brighter section around 1:30-2:00am every night is the hot water system coming on. It was using 3-4 kilowatt-hours of power each and every night, and even though it’s on the off-peak pricing and thus not costing us a heap, it’s still pretty damn inefficient. I had a close look at the system and it had a manufacturing date of 2002, so we decided it was probably time to replace it anyway. I did a bunch of research and settled on a heat pump hot water system from a company called Sanden. Heat pumps work on the same general principle as refrigerators but in the exact opposite direction, they bring in the warm ambient air from outside to heat up the water. As a result, a heat pump hot water system can use 20% of the power of a regular hot water system. We got it installed in mid-December and it looks like a regular hot water system hooked up to an air conditioning unit!
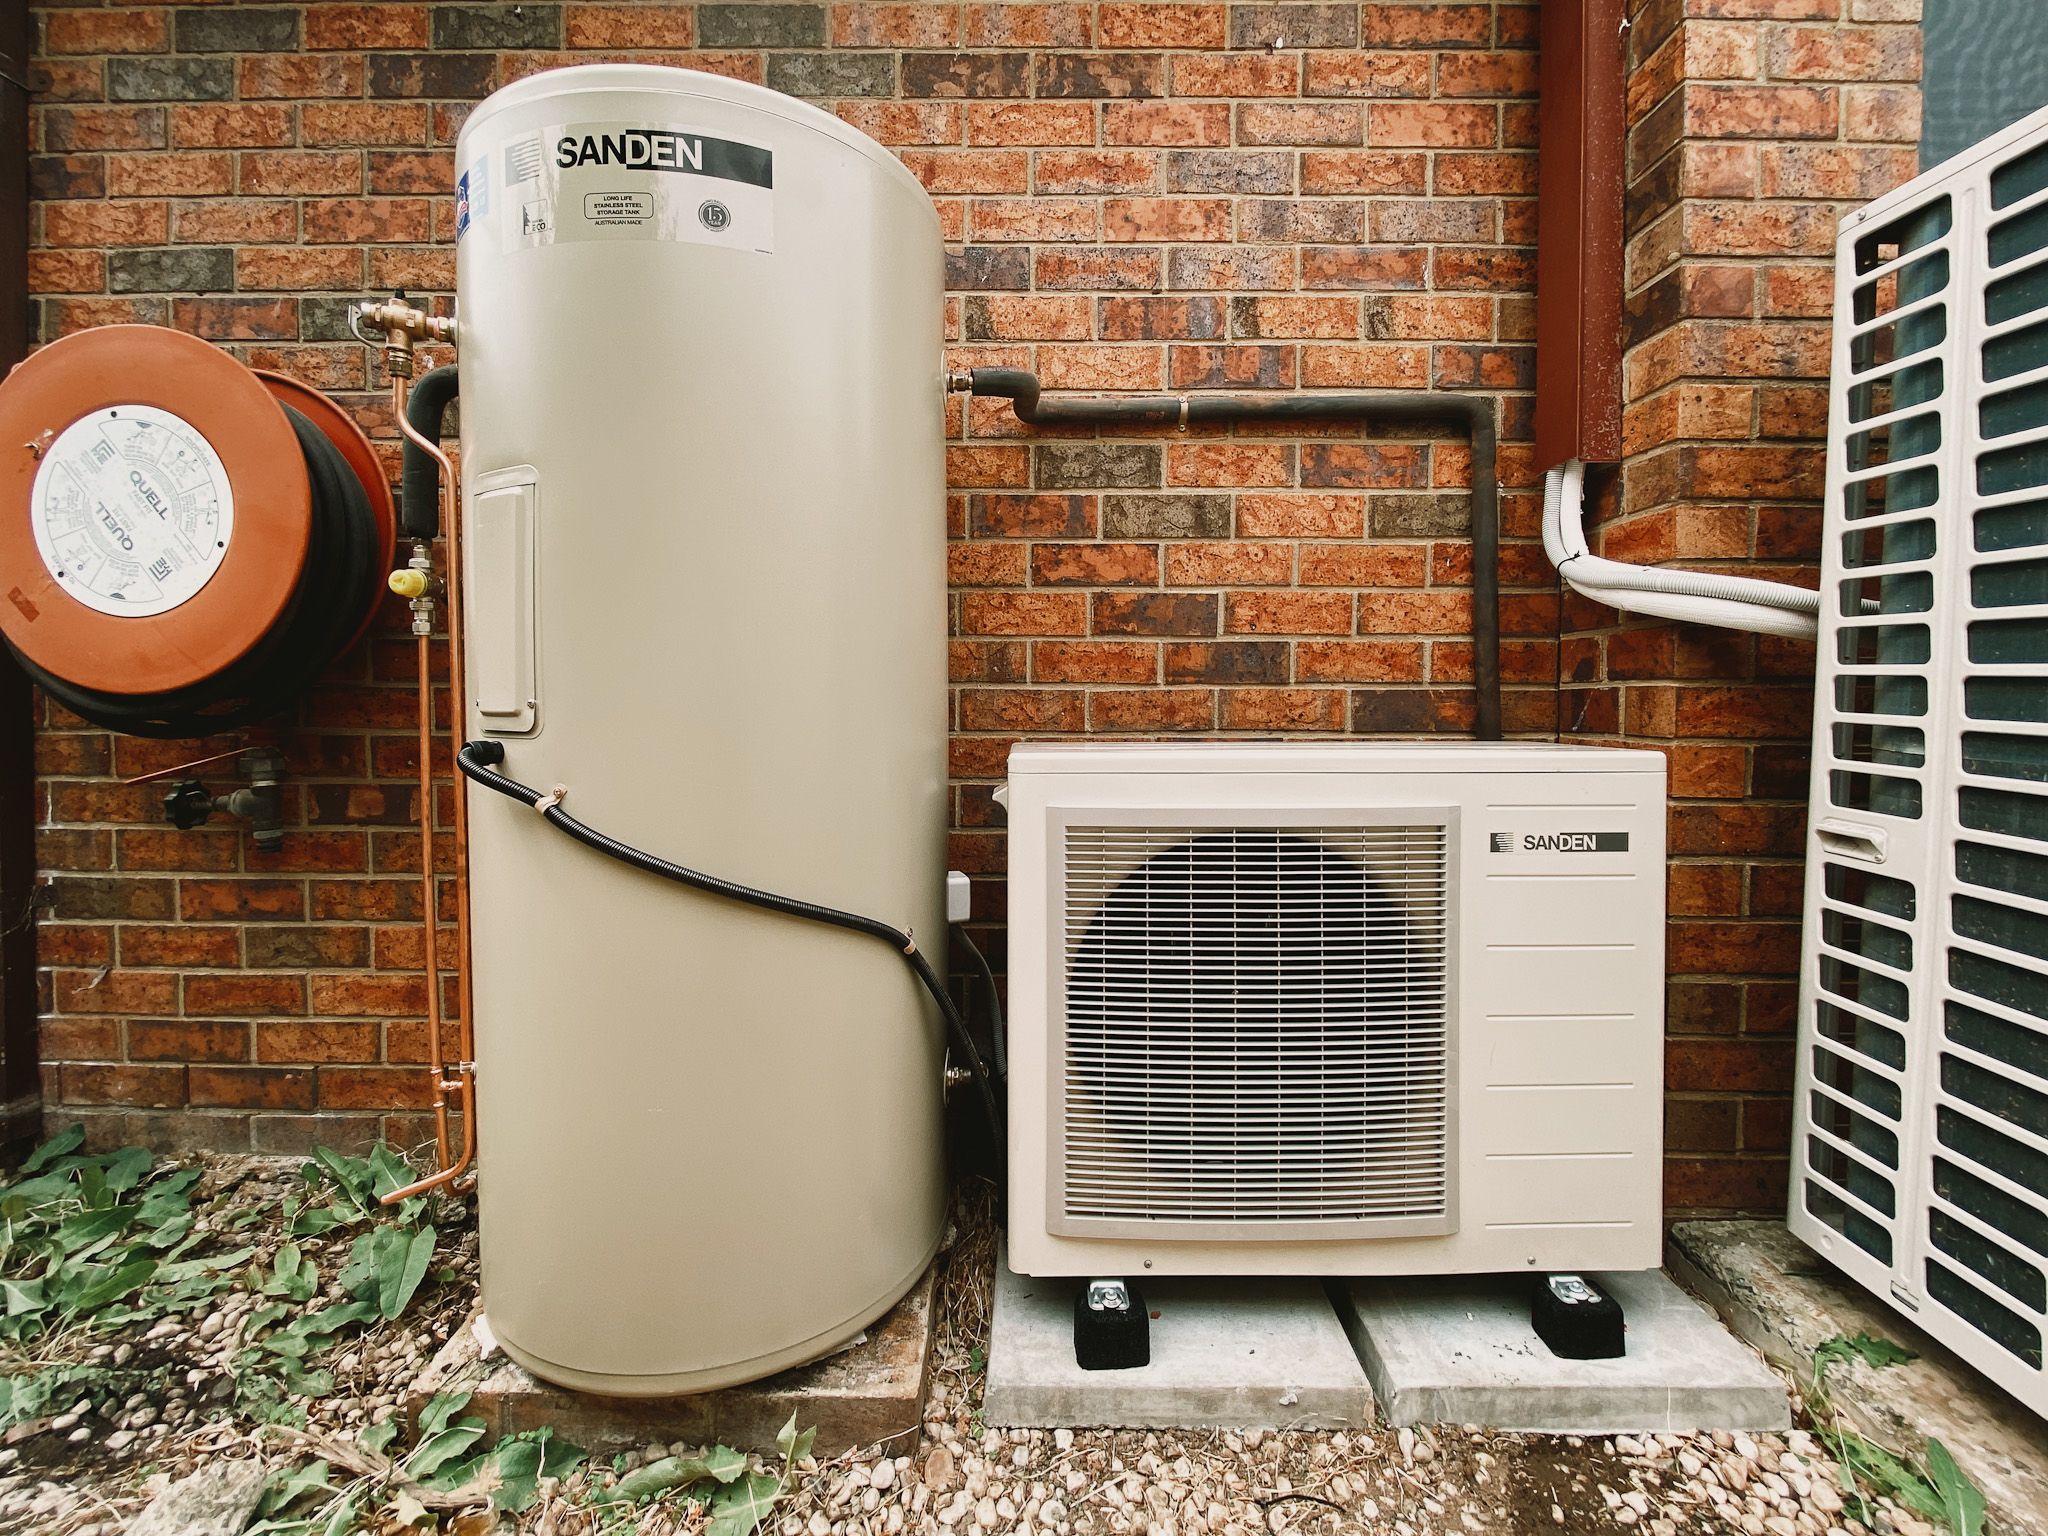
(The scale is a bit off in this photo, I had to use the ultra-wide lens in my iPhone to get all of it in the shot as I was hard up against the fence. The photo was taken from about waist height, and the water tank comes up to about shoulder height or so). One neat thing this with system is that it’s absurdly quiet, they quote only 37 decibels when it’s running.
You can very clearly see the drop in power usage when after we got it installed, no more bright line! (The extended purple section in the wee hours of the morning is because that’s right when we had a spate of hot days and the air conditioner had to run more than normal overnight).
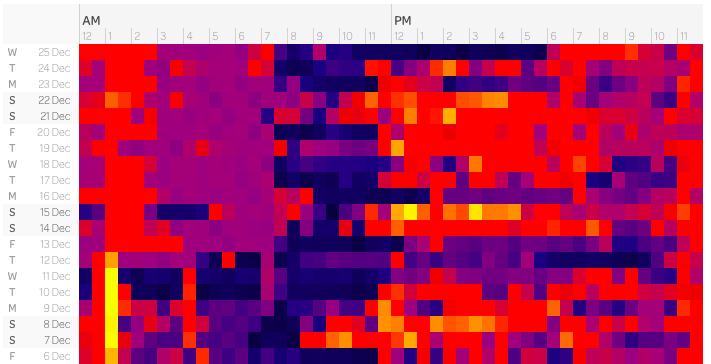
I worked out that the new system was using between 1 and 1.5kWh of power depending on what the outside temperature was (remember that it uses ambient air to heat the water, so warmer ambient air equals less power needed), which is a pretty nice improvement over the old system.
After all of this, we also decided to invest in a solar power system! There’s a fantastic website called Solar Quotes that has a ton of good info and will contact up to three installers for you to organise them to come out and give quotes. We ended up going with Penrith Solar Centre who were fantastic, and the system was installed on the 20th of last month, and it looks very handsome.
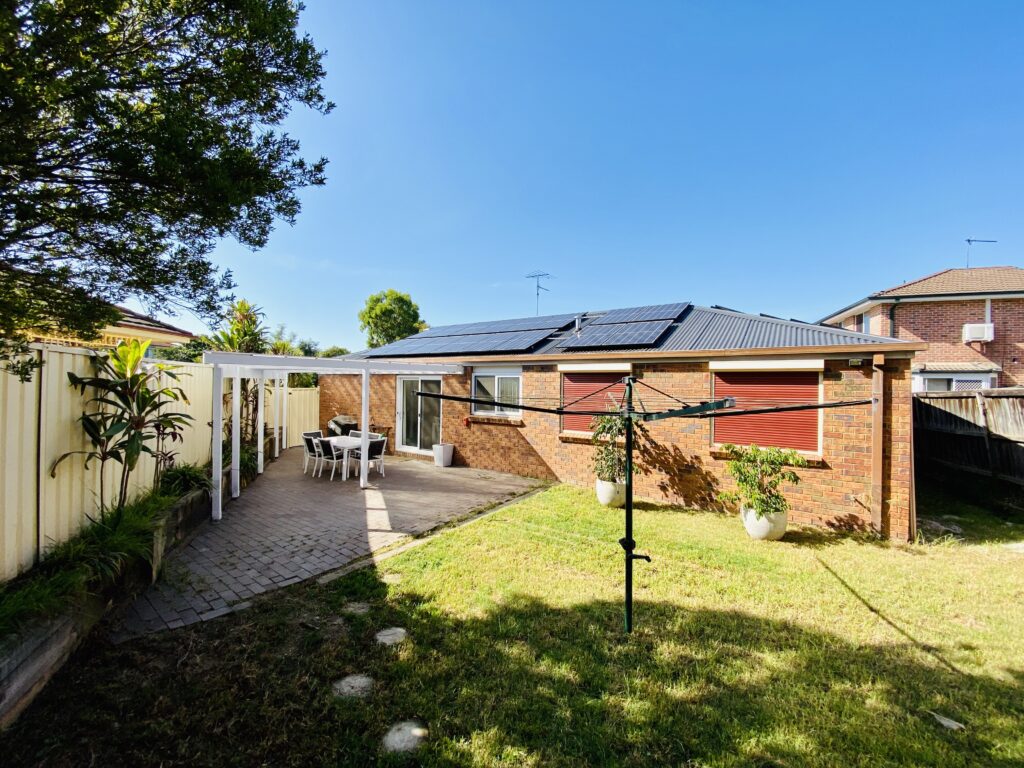
(You can also see we also had our pergola redone too, which was a bit of a shit-show and dragged on for way longer than it should have. You can see in the photo that we had it shortened a fair chunk as it was far larger than it needed to be, so now we have significantly more space for renovating our back yard when we eventually get around to doing that).
The total solar setup is 22 Hanwha Q-Cells panels — sixteen on the north-facing expanse and six on the western side — plus Enphase IQ7+ micro-inverters, and we also get Enphase’s Envoy consumption monitoring setup so we can see in real-time how much power we’re using versus how much we’re exporting back to the grid! The monitoring includes panel-level monitoring of each individual panel so if anything goes wrong with one of them, it’s immediately obvious and the solar installers can immediately see which one needs fixing or replacing.
The Envoy system took a bit of time to be activated but even before that we were able to get a sense of how much our usage had changed via Powershop’s usage heat map. You can clearly see the day the solar was installed because all the days after that have big black sections where we were using no power from the grid at all:
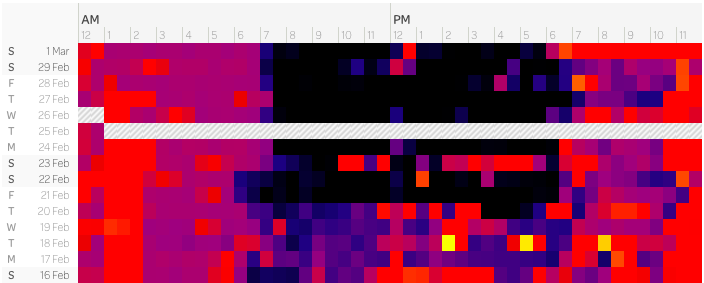
The day at the top there, the 1st of March, we were doing all of the clothes washing — so using the washing machine and the dryer — as well as having the oven on for lunch, the dishwasher running, and the the air conditioner on for most of the day, and yet only used 11.46kWh for the day, compared to what would normally be more like 30-35kWh.
Powershop also have the inverse of the usage heat map if you have solar, which is the feed-in heat map, showing how many kilowatt-hours you’ve sent back to the grid.

The especially bright yellow blocks in the middle on the 28th are just a bit under 3kWh! You can also see on the 26th of February when the clouds came over after lunch.
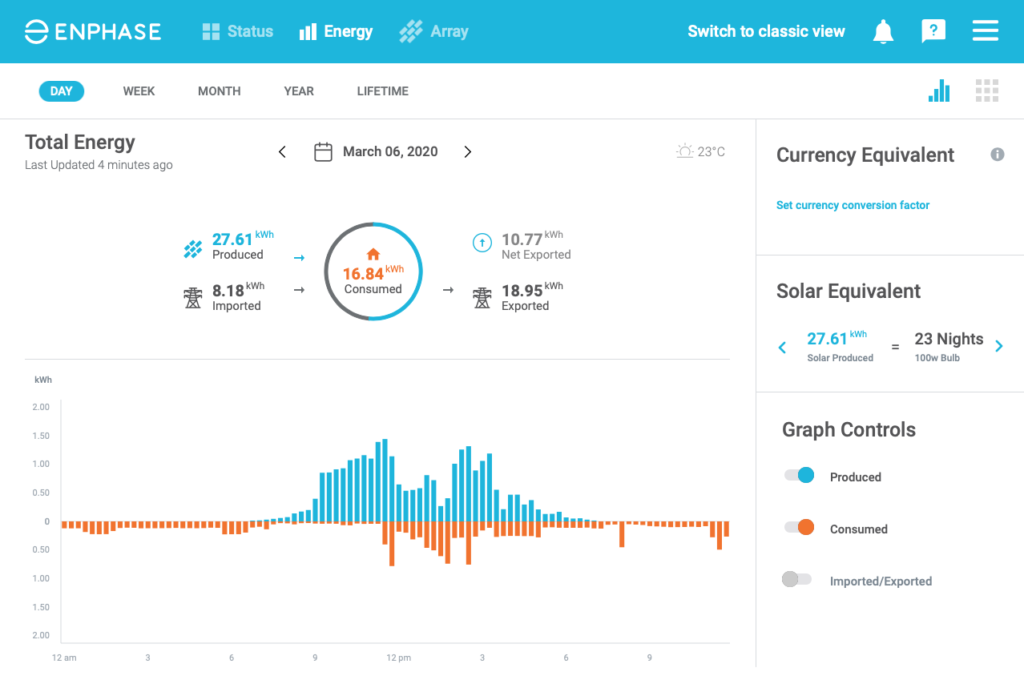
The Envoy system gives us essentially what Powershop’s heat maps do, but in real-time, and it also monitors each individual solar panel so if anything breaks with one of them or we see that it’s producing way less power, we immediately have the knowledge of which panel it is which makes Penrith Solar Centre’s job far easier if they need to come out and fix something. You also get consumption versus generation graphs in 15-minute increments as well! The blue is how much we’re producing from the solar panels and the orange is how much we’ve used. It took me a bit to work out what the circle at the top meant, but it means in total we’ve consumed 16.84kWh all up, and of that, the section of the circle is how much we consumed directly from the solar panels, whereas the grey portion is power imported from the grid.
Now that we’re generating a bunch of our own power, the other thing I wanted to do was to have our hot water run off the solar panels in the middle of the day, instead of using off-peak in the wee hours of the morning, especially since heat pump systems work best when the ambient temperature is warmer… not super useful in the middle of winter at 1am! Fortunately the Sanden system we have comes with a block-out timer so you can explicitly set when you want it to be running. I had the Penrith Solar people swap the hot water over to the regular non-off-peak meter and I configured the block-out timer so the system only comes on in the middle of the day when we’re producing power from our solar panels (and conveniently when the ambient temperature is at it highest so it needs to use even less power).
I’ll be very interested to see how this goes during winter, our power usage is generally less — we don’t use the air conditioner’s heating function because it dries everything out too much, but instead just use oil-filled radiant heaters — but from talking to people at work, the solar panels also generate only about 30% of the electricity compared to the height of summer thanks to the shorter days and lower sun.